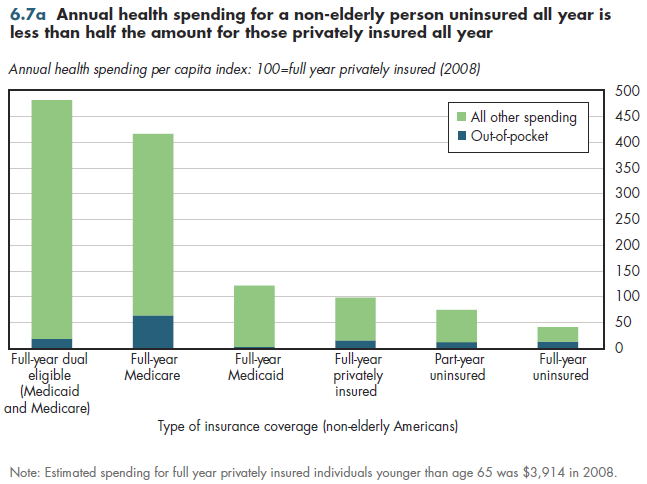
Per capita health costs for non-elderly individuals who are uninsured for the entire year are less than half the medical spending for their counterparts who have private insurance coverage (figure 6.7a). Slightly more than half of those who are uninsured at least some portion of the year are without coverage the entire year. In any given year, the part-year uninsured lack coverage for approximately six months. Therefore, individuals uninsured the entire year constitute approximately 70 percent of the number of uninsured on any given day.

Although they are uninsured half the year, seven-eighths of spending for the part-year uninsured occurs during the portion of the year they are insured. This reflects the higher propensity of insured people to get care, but it also reflects strategic behavior by those drifting in and out of coverage. By deferring care when uninsured and using care as much as feasible if they know they are likely to lose coverage, they minimize the out-of-pocket burden associated with being without coverage.
Per capita spending on those privately insured all year is lower than for those on Medicaid the entire year. This disparity would be even larger if Medicaid payments to hospitals and doctors matched the levels paid by private health plans. Much of the difference reflects Medicaid coverage of expensive services not covered by standard private health plans (for example, long-term care costs such as extended nursing- home stays or home health for those whose condition is not likely to improve). The average non-elderly person covered by Medicare (that is, work-disabled) or Medicaid is in worse health than those who have private coverage.
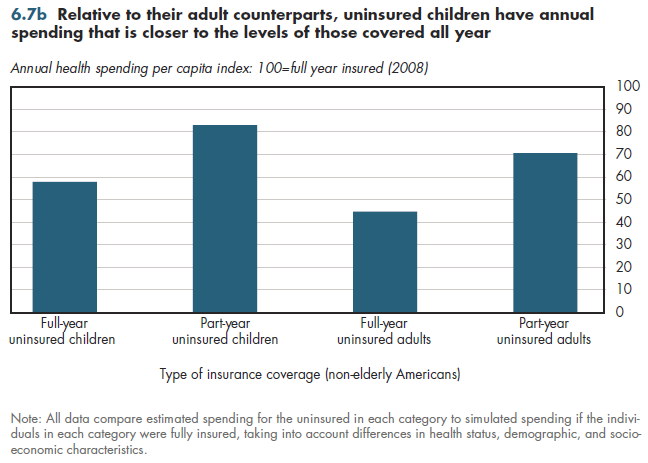
Access to care appears to be somewhat better for uninsured children relative to uninsured adults. Spending for full-year uninsured children is approximately 60 percent of the level of statistically equivalent individuals having coverage the entire year; for their counterparts who are adults, spending is less than half that for equivalent adults having full-year coverage (figure 6.7b). Publicly subsidized care might be more accessible to children (for example, free clinics); likewise, the propensity for care-seeking among uninsured adults—some who have chosen to be uninsured— might be lower.

Download Excel workbooks used to create
Figure 6.7a Table and
Figure 6.7b Table.
[Note that you’d have separate links for each set of tables] Figures 6.7a and 6.7b were created from the following tables (the workbook includes all supporting tables used to create these tables):
- Fig. 6.7a: Table 6.7.1. Indexed Per Capita Spending for Insured and Uninsured Patients, by Source of Payment, 2008
- Fig. 6.7b: Table 6.7.2. Health Spending Per Capita for Uninsured to Simulated Spending if They Were Fully Insured
Download PowerPoint versions of both figures.
- Author's calculations.
- Hadley J, J Holahan, T Coughlin and D Miller. Covering the Uninsured in 2008: A Detailed Examination of Current Costs and Sources of Payment, and Incremental Costs of Expanding Coverage. Prepared for the Kaiser Commission on Medicaid and the Uninsured. Kaiser Commission on Medicaid and the Uninsured. Washington DC. August 2008.


