Health expenditures are not a good measure of whether the burden of medical care is more or less in the United States, compared with its major competitors. If markets are less competitive in health care due to regulation or other forces, this will result in higher prices. Thus, for each unit of resources used (for example, an hour of labor), spending might be more in medical care than if the identical resource were used elsewhere in the economy. Briefly, spending might be much more than costs.
However, because higher prices result in income to someone (for example, doctors, drug company shareholders), decreasing the medical prices might change the distribution income in the economy. Nevertheless, it will not make Americans better off in the aggregate (every dollar of income "won" by buyers would be matched by a corresponding loss by the sellers of medical services).
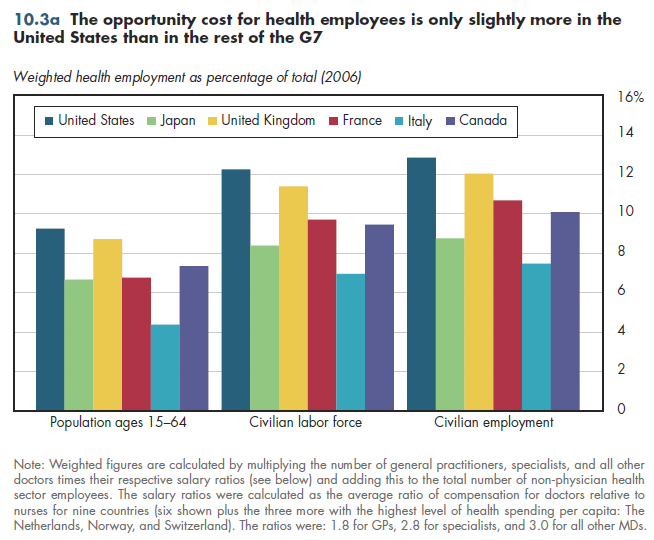
Two methods provide an approximate measure of the opportunity cost of health services labor across countries. One approach calculates the percentage of the population employed in health care. This method assumes that the cost to any economy of diverting a worker into the health care sector is approximated by GDP per worker in that economy. However, this would be a poor approximation for doctors, whose value to the economy presumably would be much higher than average GDP per employee even if they were employed elsewhere. Taking this into account — by weighting employment by the average ratio of doctor compensation to nurse compensation in the countries shown in figure 10.3a — the U.S. share of employment is higher than in its competitors, but not by much.

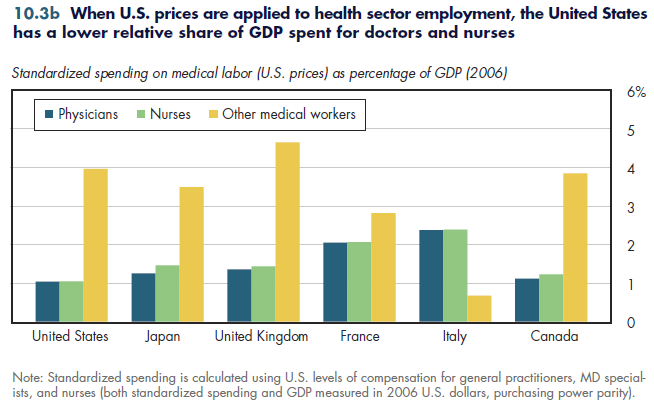
Another approach assumes that the opportunity cost of health workers is the same elsewhere as in the United States. When applying U.S. prices to the number of physicians, nurses, and other workers, the opportunity cost of medical labor is lower in the United States than in any of its major competitors (figure 10.3b). That is, after accounting for the higher prices paid for medical labor in the United States, the level of potential output these nations give up to produce health care is greater than in the United States.

Neither of these exactly measures U.S. comparative performance. However, the truth is likely to fall somewhere in between these estimates.
Download PowerPoint versions of both figures.
Download Excel tables used to create
Figures 10.3a/10.3b Tables.
Figures 10.3a and 10.3b were created from the following tables (the workbook includes all supporting tables used to create this table):
- Fig. 10.3a: Table 10.3.1. Total Weighted Health Employment as a Percentage of Population in Selected Industrialized Countries, 2006
- Fig. 10.3b: Table 10.3.2. Standardized Expenditures on Medical Care Labor, as a Percentage of GDP in Selected Industrialized Countries, 2006
- Author's calculations.
- Organisation for Economic Co-operation and Development.
- Pauly MV. U.S. Health Care Costs: The Untold True Story. Health Affairs 1993;12(3):152-59.


