Skip to content Skip to navigation Skip to collection information

You are here: Home » Content » American Health Economy Illustrated » 1.2 Growth in Inflation-Adjusted Health Output per Capita over 80 Years
Content affiliated with: American Enterprise Institute

Navigation

Table of Contents

Lenses

What is a lens?

Definition of a lens

Lenses

A lens is a custom view of the content in the repository. You can think of it as a fancy kind of list that will let you see content through the eyes of organizations and people you trust.

What is in a lens?

Lens makers point to materials (modules and collections), creating a guide that includes their own comments and descriptive tags about the content.

Who can create a lens?

Any individual member, a community, or a respected organization.

What are tags? tag icon

Tags are descriptors added by lens makers to help label content, attaching a vocabulary that is meaningful in the context of the lens.

This content is ...

Affiliated with (What does "Affiliated with" mean?)

This content is either by members of the organizations listed or about topics related to the organizations listed. Click each link to see a list of all content affiliated with the organization.
  • AEI

    This collection is included in aLens by: American Enterprise Institute

    Click the "AEI" link to see all content affiliated with them.

Recently Viewed

This feature requires Javascript to be enabled.
Download
×

Download collection as:

  • PDF
  • EPUB (what's this?)

    What is an EPUB file?

    EPUB is an electronic book format that can be read on a variety of mobile devices.

    Downloading to a reading device

    For detailed instructions on how to download this content's EPUB to your specific device, click the "(what's this?)" link.

  • More downloads ...

Download module as:

  • PDF
  • EPUB (what's this?)

    What is an EPUB file?

    EPUB is an electronic book format that can be read on a variety of mobile devices.

    Downloading to a reading device

    For detailed instructions on how to download this content's EPUB to your specific device, click the "(what's this?)" link.

  • More downloads ...
Reuse / Edit
×

Collection:

Module:

Add to a lens
×

Add collection to:

Add module to:

Add to Favorites
×

Add collection to:

Add module to:


1.2 Growth in Inflation-Adjusted Health Output per Capita over 80 Years

Module by: Christopher Conover. E-mail the author

Summary: Inflation-adjusted health output per capita has increased at least eight-fold over the past 80 years.

Adjusting medical care prices in several ways, inflation-adjusted health care output rose at least 20-fold over the past 80 years. Estimates of NHE output cannot be precise; thus, estimates of changes over decades are unavoidable approximations.1 NHE includes many different goods and services. No adequate way exists to convert them to a common unit of output to measure a combined total. Therefore, adding all health care goods and services in proportion to their relative prices is customary.2

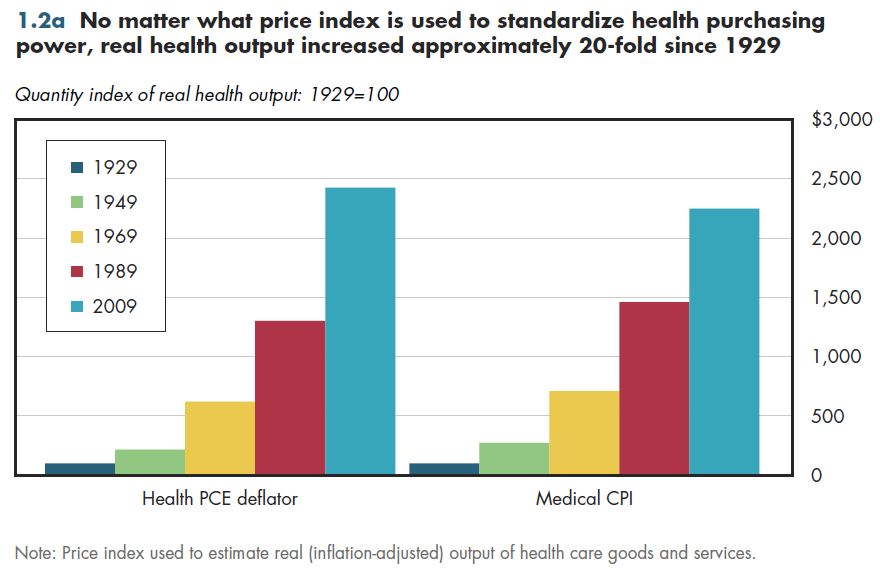
For decades, medical price inflation usually has outpaced general inflation. To gauge how much the quantity of NHE has grown exclusive of medical price changes, NHE must be deflated by a measure of price inflation specific to medical care. Because relative prices change over time (for example, the hourly rate of physician pay versus that of licensed practical nurses [LPNs]), the measured size of the health sector depends on the year of the prices used.3

Both the health care deflator for personal consumption expenditures (PCE) and the CPI for medical care have limitations.4 The PCE health care deflator counts all household medical care use regardless of how it is financed.5 Therefore, it is a more complete measure of price changes across the entire medical market. The medical CPI is intended to reflect household out-of-pocket prices.6 Consequently, it places a smaller weight on expensive services disproportionately paid by insurance, such as hospital care.7 Either index shows that real health output is at least 20 times as large as it was in 1929 (figure 1.2a).

No matter what price index is used to standardize health purchasing power, real health output increased approximately 20-fold since 1929.

NHE generally includes only output that is bought or sold in markets (including hospital and doctor care, even if these are provided "free" to the patient). It understates total output by excluding informal care provided by family or friends despite its importance for long-term care patients.8 Good data do not exist for every item included in the NHE.

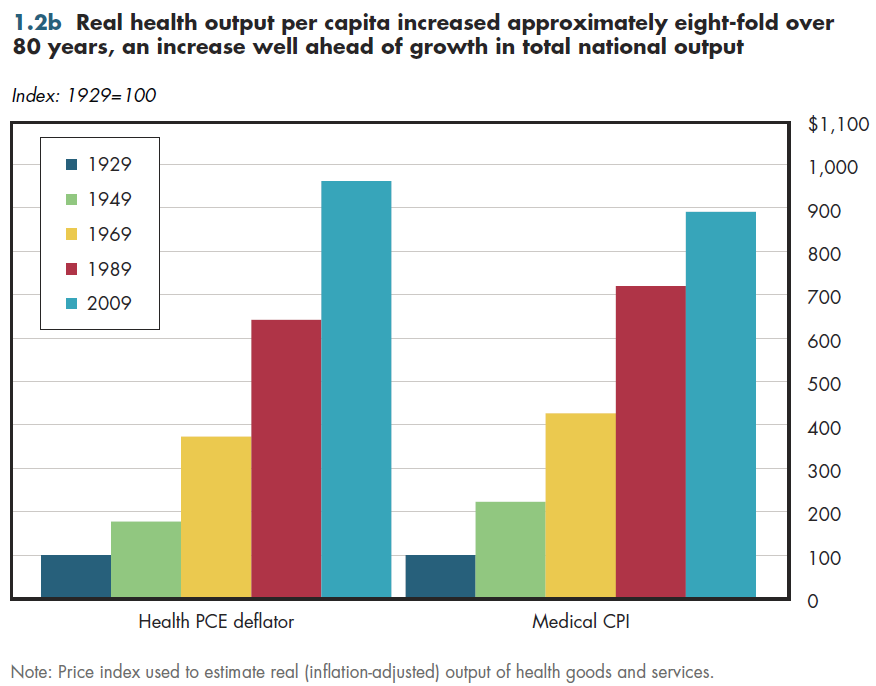
Real health output per person rose at least eight-fold in this period (figure 1.2b)— an amount much more comparable to the quintupling of real economic output per resident shown in figure 1.1b. There is little question that this increase in health output per capita has contributed to better health and longevity. However, which of these health gains has been worth its cost is a matter of considerable debate.

Real health output per capita increased approximately eight-fold over 80 years, an increase well ahead of growth in total national output.

Downloads

Download Excel tables used to create both figures: Figures 1.2a/1.2b Tables. Figures 1.2a and 1.2b both were created from the following table (the workbook includes all supporting tables used to create this table):

  • Table 1.1 | U.S. Total Real National Health Expenditures Using Alternative Price Deflators: 1929 to 2021

Download PowerPoint versions of both figures.

References

Note that the downloadable Excel tables contain a detailed description of methods and sources; the extensive references are not replicated here. Below are references cited in footnotes for this module.

  1. Agency for Healthcare Research and Quality (AHRQ). 2013. Using Appropriate Price Indices for Analyses of Health Care Expenditures or Income Across Multiple Years. Last updated March 2013. Available at: http://meps.ahrq.gov/about_meps/Price_Index.shtml (accessed April 23, 2013).
  2. Bureau of Economic Analysis (BEA). 2013a. NIPA Tables Help. Available at: http://www.bea.gov/national/nipaweb/NIPAHelp.htm (accessed September 3, 2013).
  3. BEA.  2013b. Table 1.1.9. Implicit Price Deflators for Gross Domestic Product. Last revised July 31, 2013.  Available at: http://www.bea.gov/iTable/iTable.cfm (accessed August 10, 2013).
  4. Bureau of Labor Statistics (BLS). 2013. Consumer Price Index - All Urban Consumers (base period 1982-1984=100; not seasonally adjusted). Available at: http://www.bls.gov/data/#prices (accessed April 23, 2013).
  5. Feinberg, Lynn, Susan C. Reinhard, Ari Houser, and Rita Choula. 2011. Valuing the Invaluable: 2011 Update. The Growing Contributions and Costs of Family Caregiving. Washington, D.C.: AARP Public Policy Institute. July 2011. Available at: http://assets.aarp.org/rgcenter/ppi/ltc/i51-caregiving.pdf (accessed September 3, 2013).

Footnotes

  1. The same is true of measuring economic output in general, i.e., gross domestic product.
  2. This is identical to the approach used to estimate gross domestic product.
  3. For example, assume physicians are paid 3 times as much as LPNs in Year 1 and 4 times as much in Year 10. Assume that health output consisted of 1 million hours of physician time and the equivalent number of hours of LPN time in both years. Even though output is unchanged in this example, the measured size of the health sector would be 25% larger in Year 10 [1m. x (1 LPN wage unit) + 1m. x (3 LPN wage units) =4m. LPN wage units, whereas the same calculation substituting 4 LPN wage units to value each hour of physician time yields 5m. LPN wage units.
  4. Another important difference is that the PCE implicit price deflator is essentially equivalent to a chain-type price index. The BEA observes "chain-type estimates provide the best available method for comparing the level of a given series at two points in time" (BEA 2013a). The chief limitation of a fixed-weight price index such as the medical CPI is that it used fixed price weights in a base year and measures pure changes in prices. In the preceding example, where the weights (relative output of physicians vs. LPNs) did not change, such a price index is perfectly adequate since so long as we use either Year 1 or Year 10 prices, we will deduce there has been no change in output between the two years. But in reality, if physician prices go up faster than LPN wages, there may be some substitution of nurses for doctors (to the degree that's possible), so the weights would likely change. Total weighted output conceivably could decline in this instance. Thus, a fixed-price index would erroneously conclude that the "medical cost of living" had risen by 25% when in reality--once both substitution of lower-cost LPN services for higher-cost MD services was taken into account--the actual increase in the cost of living would be more modest. In contrast, a chain-type price index allows for weights to continuously change (e.g., annually) (technically, an implicit price deflator is calculated as the ratio of current-dollar value to the corresponding chained-dollar value multiplied by 100; according to the BEA, "the values of the IPD and of the corresponding "chain-type" price index are very close." (BEA 2013a). This is why Congress is debating whether to use the chained CPI rather than regular (fixed-weight) CPI in calculating cost-of-living increases for government programs. It would be more accurate and would save the federal government a growing amount with each passing year.
  5. The BEA calculates implicit price deflators for a large number of components of GDP, not just health care (BEA 2013b).
  6. The Bureau of Labor Statistics has been measuring prices of a broad range of items since 1913 (BLS 2013).
  7. AHRQ (2013) provides an extensive explanation of which medical price index is appropriate to use in different contexts.
  8. According to AARP, the economic value of family caregivers was $450 billion in 2009 (Feinberg et al. 2011). Inclusion of this cost would have added 18% to NHE that year.

Collection Navigation

Content actions

Download:

Collection as:

PDF | EPUB (?)

What is an EPUB file?

EPUB is an electronic book format that can be read on a variety of mobile devices.

Downloading to a reading device

For detailed instructions on how to download this content's EPUB to your specific device, click the "(?)" link.

| More downloads ...

Module as:

PDF | EPUB (?)

What is an EPUB file?

EPUB is an electronic book format that can be read on a variety of mobile devices.

Downloading to a reading device

For detailed instructions on how to download this content's EPUB to your specific device, click the "(?)" link.

| More downloads ...

Add:

Collection to:

My Favorites (?)

'My Favorites' is a special kind of lens which you can use to bookmark modules and collections. 'My Favorites' can only be seen by you, and collections saved in 'My Favorites' can remember the last module you were on. You need an account to use 'My Favorites'.

| A lens I own (?)

Definition of a lens

Lenses

A lens is a custom view of the content in the repository. You can think of it as a fancy kind of list that will let you see content through the eyes of organizations and people you trust.

What is in a lens?

Lens makers point to materials (modules and collections), creating a guide that includes their own comments and descriptive tags about the content.

Who can create a lens?

Any individual member, a community, or a respected organization.

What are tags? tag icon

Tags are descriptors added by lens makers to help label content, attaching a vocabulary that is meaningful in the context of the lens.

Module to:

My Favorites (?)

'My Favorites' is a special kind of lens which you can use to bookmark modules and collections. 'My Favorites' can only be seen by you, and collections saved in 'My Favorites' can remember the last module you were on. You need an account to use 'My Favorites'.

| A lens I own (?)

Definition of a lens

Lenses

A lens is a custom view of the content in the repository. You can think of it as a fancy kind of list that will let you see content through the eyes of organizations and people you trust.

What is in a lens?

Lens makers point to materials (modules and collections), creating a guide that includes their own comments and descriptive tags about the content.

Who can create a lens?

Any individual member, a community, or a respected organization.

What are tags? tag icon

Tags are descriptors added by lens makers to help label content, attaching a vocabulary that is meaningful in the context of the lens.

Reuse / Edit:

Reuse or edit collection (?)

Check out and edit

If you have permission to edit this content, using the "Reuse / Edit" action will allow you to check the content out into your Personal Workspace or a shared Workgroup and then make your edits.

Derive a copy

If you don't have permission to edit the content, you can still use "Reuse / Edit" to adapt the content by creating a derived copy of it and then editing and publishing the copy.

| Reuse or edit module (?)

Check out and edit

If you have permission to edit this content, using the "Reuse / Edit" action will allow you to check the content out into your Personal Workspace or a shared Workgroup and then make your edits.

Derive a copy

If you don't have permission to edit the content, you can still use "Reuse / Edit" to adapt the content by creating a derived copy of it and then editing and publishing the copy.

  • © 2012 Regents of the University of Minnesota. All rights reserved.
  • The University of Minnesota is an equal opportunity educator and employer. Privacy
  • Last modified on Sep 26, 2013 1:16 pm -0500