Download PowerPoint versions of both figures.
Inside Collection (Book): American Health Economy Illustrated
12.2 The Lowest-Income Families Have 2.5 Times Burden of Paying for Health Care Than That of the Highest-Income Families
Summary: After accounting for all hidden costs and subsidies, the net burden of paying for health care is 2.5 times as much for the very lowest-income families compared with the very highest-income families.
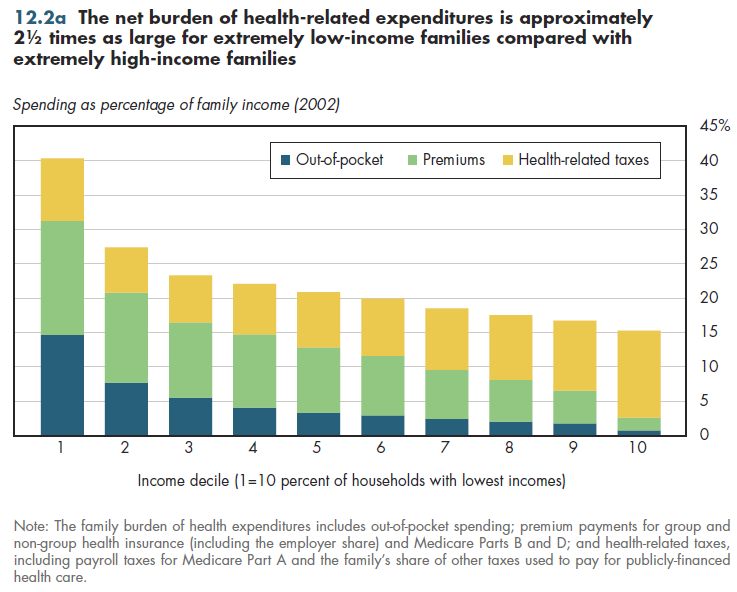
Households at the bottom of the income distribution devote more than 40 percent of their income to paying for health care (figure 12.2a). The corresponding number for those who have the highest incomes is approximately 15 percent. Thus, the relative burden (measured in terms of shares of income) is approximately 2½ times more for the first group compared with the last.

These data account for the entire burden of health spending for families in each income group. The spending data shown include the readily visible amounts paid by the family for out-of-pocket spending and premiums but also the hidden costs, such as the net employer share of premiums after subtracting any tax subsidies for health coverage. The hidden costs also include each family's estimated share of various payroll, income, and other taxes used to finance Medicare, Medicaid, and other health care spending.
Two points are worth noting. First, the burden at the lowest end of the distribution would be considerably less if it were based on actual annual expenditures by these households rather than income (which is negative or zero for a non-trivial number of households in the lowest-income bracket). Second, tax-financed health care is to some considerable degree targeted for those who have lower incomes (refer to figure 4.2b). Therefore, a measure of actual expenditures for health care (including tax-subsidized care) would result in a ratio that would likely be much higher. Thus, the net burden is considerably more evenly distributed than if families had to pay for all health expenses entirely on their own.
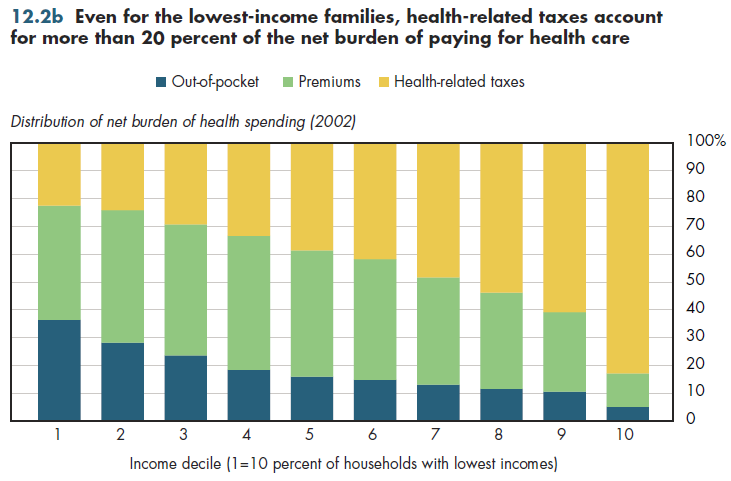
Out-of-pocket spending accounts for more than 30 percent of this burden for the lowest income families compared with less than 5 percent for those with the high- est incomes (figure 12.2b). Conversely, health-related taxes make up more than 80 percent of the burden at the highest end of the income distribution compared with just over 20 percent for those at the lowest end. The premium share of the burden increases to the middle of the income distribution but declines thereafter.

Downloads
References
- Selden TM. Using Adjusted MEPS Data to Study Incidence of Health Care Finance. Agency for Healthcare Research and Quality. http://www.ahrq.gov/about/annual conf09/selden/selden.ppt (accessed July 16, 2010).
Collection Navigation
- « Previous module in collection 12.1 1% of Population Accounts for 25% of Health Spending
- Collection home: American Health Economy Illustrated
- Next module in collection » 12.3 Burden of Paying for Health Care Has Increased
Content actions
Give feedback:
Download:
Add:
Reuse / Edit:
Twin Cities Campus:
- © 2012 Regents of the University of Minnesota. All rights reserved.
- The University of Minnesota is an equal opportunity educator and employer. Privacy
- Last modified on Oct 18, 2013 2:21 pm -0500


