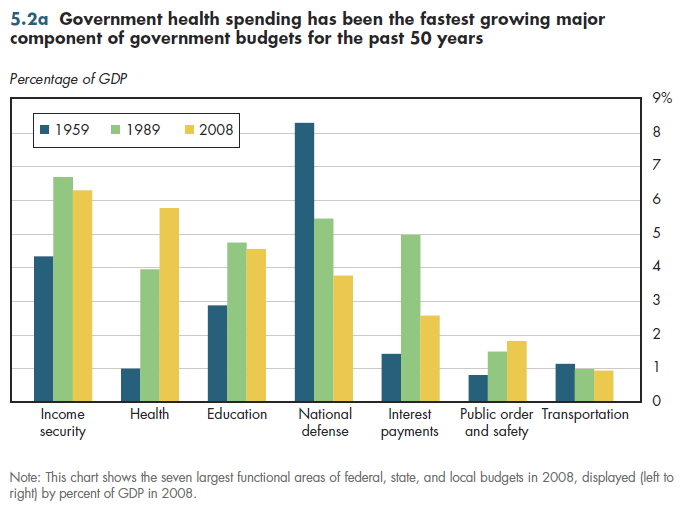
Tax-financed health expenditures over the past 50 years have grown faster than any other major functional area of government spending, including defense, income sup- port, and education. Since 1959, the increase in government health spending as a percentage of GDP more than exceeded the decline in defense spending's share of the economy through 2008 (figure 5.2a).

Along with defense, transportation funding declined as a share of GDP relative to 1959 levels. In the aftermath of the Great Society initiatives in the 1960s, it should not be too surprising that both income support and education grew as a percent of GDP between 1959 and 1989, but both also subsequently had declined by 2008. Even interest payments on the national debt followed a similar path (although this will change considerably in the decades going forward).
Of the seven largest functional areas of federal, state, and local budgets, the only one (other than health care) that grew in the 30 years from 1959 to 1989 and the almost-30 years from 1989 to 2008 was spending for public order and safety. However, the increase in GDP share attributable to government-paid health care during this period was almost five times as large as the increase for public order and safety.
This highlights the reason why health care has become such an intense focus of attention at all levels of government in recent years. In almost every state, health care has become either the largest or the fastest-growing component of public spending, making it increasingly difficult to finance other priorities such as education or criminal justice.
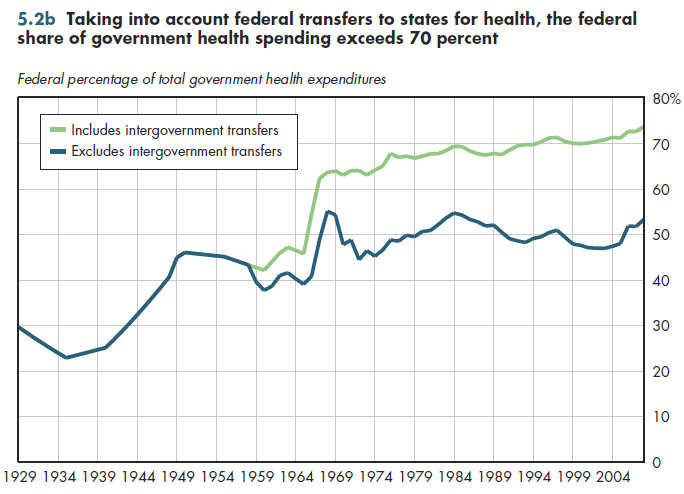
The federal share of government-paid health spending has generally risen during this period, as has the role played by intergovernmental transfers (IGTs) of funds from the federal government to state and local governments (figure 5.2b). These include federal matching funds provided under Medicaid (ranging from a minimum of 50 percent in the wealthiest states such as New York and Massachusetts to more than 80 percent in Mississippi), federal categorical grants for health care, and federal block grants for health care, such as maternal and child health services. If IGTs are counted on the federal side of the ledger, the federal share of health spending is now approaching 75 percent.

Download Excel workbooks used to create
Figure 5.2a Table and
Figure 5.2b Table.
[Note that you’d have separate links for each set of tables] Figures 5.2a and 5.2b were created from the following tables (the workbook includes all supporting tables used to create these tables):
- Fig. 5.2a: Table 5.2.1. Government Current Expenditures as a Percentage of GDP, 1959-2010
- Fig. 5.2b: Table 5.2.2. Federal Health Expenditures as a Percentage of Total Federal, State and Local Health Expenditures, 1929-2021
Download PowerPoint versions of both figures.
- Author's calculations.
- Department of Commerce. Bureau of Economic Analysis.
- Department of Health and Human Services. Centers for Medicare and Medicaid Services.
- Worthington NL. National Health Expenditures, Calendar Years 1929-73. Research and Statistics Note No 1. Office of Research and Statistics 1975.


