Inside Collection (Book): American Health Economy Illustrated
5.1 Bonus Material: Contribution of Health to Growth in Government Spending
Summary: This module documents the extent to which tax-financed health spending has contributed to growth in the size of government both at the federal and state and local levels.
Health spending has been a significant driver in the growing size of government at all levels
Health spending has been the principal factor behind the growth in government as a share of the economy over the past few decades.

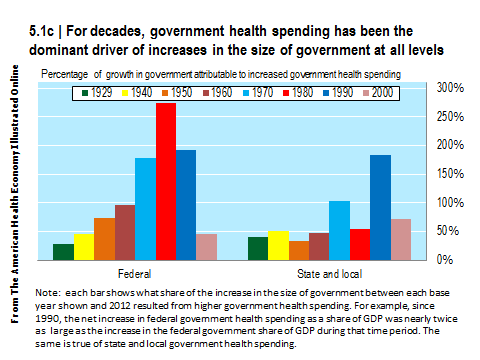
This chart essentially shows that between 1980 and 2012, for every dollar of increase in the size of the federal government, more than $2.50 was the result of higher health care spending. That is, health care not only accounted for every penny in the increase in the federal share of GDP, but it also crowded out an additional $1.50 in federal spending that used to be spent on something else, such as national defense (national defense is the component of government spending that shrank the most during this period). The story is similar—though less extreme—at the state and local government level. Fully 100% of the growth in state and local government since 1970 was due to health care. Since 1990—due to the explosive growth in Medicaid, health care has been responsible for 175% of the growth. That is, like the federal government, state and local governments have seen health care account for every penny of the increase in state and local government while also crowding out roughly 75 cents in spending on things many taxpayers might view as much more important (or at least of equivalent importance), such as education or criminal justice.
POWERPOINT DOWNLOAD
EXCEL DOWNLOAD
Download Excel tables used to create this figure: Figure 5.1c Table. The workbook contains several supporting worksheets, but the data used to produce the figure come from Table 5.1.3. Cumulative Share of Total Government Spending Growth Attributable to Growth in Government Health Care for Selected Base Years: 1929-2021.
Collection Navigation
- « Previous module in collection 5.1 Government Expenditures for Health, 1929-2009
- Collection home: American Health Economy Illustrated
- Next module in collection » 5.2 Health Component Grew the Fastest in Government Spending
Content actions
Give feedback:
Download:
Add:
Reuse / Edit:
Twin Cities Campus:
- © 2012 Regents of the University of Minnesota. All rights reserved.
- The University of Minnesota is an equal opportunity educator and employer. Privacy
- Last modified on Oct 18, 2013 3:23 pm -0500


