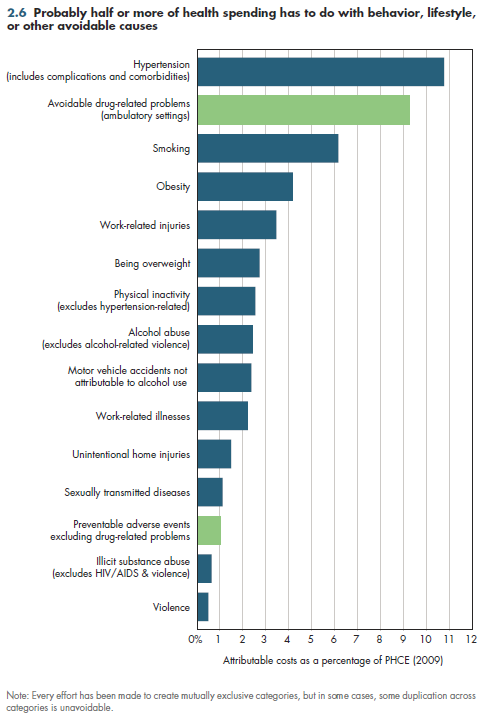
Accounting for expenditures based on disease classification clouds the extent to which much health spending is avoidable. Consider the underlying causes of diseases that give rise to health spending. Figure 2.6 lists 15 such causes, together with estimates of the share of 2009 PHCE attributable to these causes. These are approximate estimates calculated by estimating the fraction of PHCE devoted to underlying causes in a reference year (usually 2000 or later, but in some cases as early as 1992). This fraction was assumed to be identical in 2009.

Another caveat is that there might be some overlap between categories. Although every effort was made to create categories that were mutually exclusive, limitations in how data were reported sometimes precluded doing this in every case where it was needed. Taken at face value, these 15 categories collectively account for just over half of PHCE. In light of the minimal duplication that remains, it appears almost certain that these categories collectively account for a minimum of 40 percent of PHCE.
Figure 2.6 defines behavior broadly, including efforts by individual people to live healthier lives. It also can include actions taken to improve health system performance (shown in green, for example, reducing medical errors), other worksite activities to improve worker safety, transportation safety efforts to improve the quality of roads and/or automobiles, or even efforts to improve nutrition for schoolchildren.
Note that the data represent the gross amount of health spending that hypothetically could be avoided in a perfect world. Because we do not live in a perfect world, it is not possible to eradicate every dollar of avoidable spending. Although individual efforts to "try harder" can yield fruitful results virtually without costs, any serious effort to influence spending of this magnitude would require an investment of resources to alter systems (for example, electronic medical records to reduce medication errors) or behaviors (for example, smoking cessation aids). Although it never would make sense to spend a dollar to save less than a dollar, some of these initiatives might well use a sizable fraction of the potential savings. Thus, it would be imprudent to spend hundreds of billions in potential savings before ascertaining the actual net savings attainable.
- Colditz GA. Economic Costs of Obesity and Inactivity. Medicine and Science in Sports and Exercise 1999; 31(11):S663-S667.
- Department of Health and Human Services. Centers for Disease Control and Prevention.
- Department of Transportation. National Highway Traffic Safety Administration.
- Ernst FR and AJ Grizzle. Drug-Related Morbidity and Mortality: Updating the Cost-of-Illness Model. Journal of the American Pharmaceutical Association 2001; 41:192-99. http://web.whittier.edu/chemistry/newdrug/DrugRelated.pdf (accessed March 28, 2010).
- Executive Office of the President. Office of National Drug Control Policy.
- Finkelstein EA, IC Fiebelkorn and G Wang. National medical spending attributable to overweight and obesity: How much, and who's paying? Health Affairs 2003; W3:219-26.
- Harwood H, D Fountain and G Livermore. The Economic Costs of Alcohol and Drug Abuse in the United States 1992. Report prepared for the National Institute on Drug Abuse and the National Institute on Alcohol Abuse and Alcoholism. National Institutes of Health. Department of Health and Human Services. NIH Publication No 98-4327. Rockville MD. NIH 1998. http://www.nida.nih.gov/EconomicCosts/ (accessed March 28, 2010).
- Harwood H. Updating Estimates of the Economic Costs of Alcohol Abuse in the United States: Estimates, Update Methods, and Data. Report prepared by the Lewin Group for the National Institute on Alcohol Abuse and Alcoholism. December 2000. http://pubs.niaaa.nih.gov/publications/economic-2000/alcoholcost.pdf (accessed March 28, 2010).
- Zaloshnja E, TR Miller, BA Lawrence and E Romano. The Costs of Unintentional Home Injuries. American Journal of Preventive Medicine 2005; 28(1):88-94.
Download Excel tables used to create figure:
Figure 2.6 Table.
Figure 2.6 was created from the following table (the workbook includes all supporting tables used to create this table):
- Table 2.6. Distribution of U.S. Personal Health Expenditures (PHCE) Related to Selected Behavior, Lifestyle or Other Avoidable Causes, 2011 and 2013
Download PowerPoint versions of figure.


