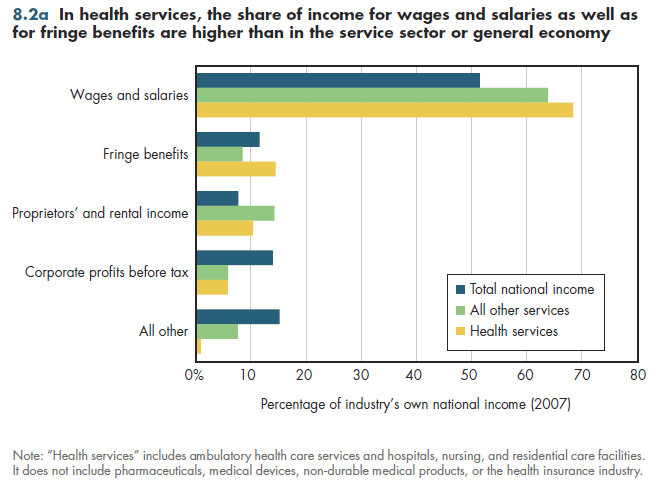
A much higher share of national income for the health services sector flows to employee compensation than in the economy in general (figure 8.2a). The share allocated to wages and salaries, and fringe benefits, is higher than in the economy overall or in the services sector. The combined total exceeds 80 percent of health services-related national income. In the breakdown in figure 8.2a, health services include ambulatory care, hospitals, nursing homes, and residential care facilities. The category excludes the pharmaceutical industry, medical devices, and non-durable medical products sold in retail outlets such as pharmacies. More than 90 percent of national income from health facilities goes to employee compensation, compared with approximately 75 percent of national income having to do with ambulatory health services.

The share accounted for by proprietors' and rental income is more in the health services industry than in the general economy, albeit less than that in the services industry overall. Conversely, the share flowing into pre-tax corporate profits is twice as much in the general economy as in the health services industry, reflecting the dominance of non-profit and public service providers in health care described in chapter 7.
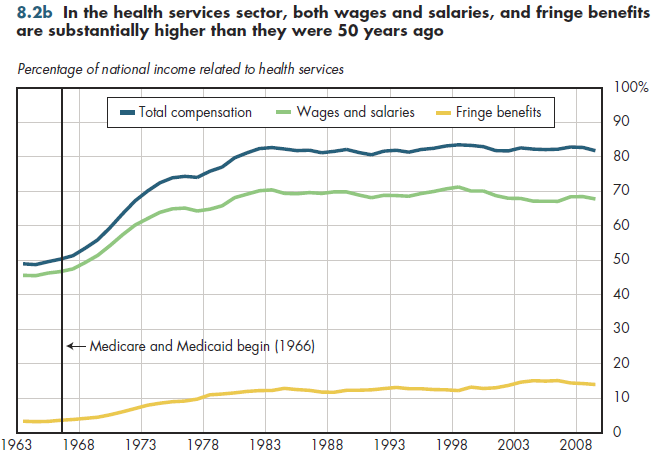
The employee compensation share of national income in the health services sector has grown dramatically in less than 50 years (figure 8.2b). Just before the introduction of Medicare and Medicaid (which began in 1966), employee compensation accounted for less than half of the national income generated by health services. But in less than 20 years after the massive infusion of public dollars into these new entitlement programs, the employee compensation share had climbed to more than 80 percent (where it has stayed ever since).

Unionization has helped spur this growth, but another factor has been the declining share of health services national income that went to proprietors' and rental income. Physicians who own their own practices get proprietors' income rather than wages. However, an increasing number of physicians are salaried, thereby elevating the relative importance of wages as a form of health sector compensation.
Download Excel tables used to create
Figures 8.2a/8.2b Tables.
Figures 8.2a and 8.2b were created from the following tables (the workbook includes all supporting tables used to create this table):
- Fig. 8.2a: Table 8.2.1. Percentage Distribution of National Income Related to Health Services, 2007
- Fig. 8.2b: Table 8.2.2. Employee Compensation as a Percentage of National Income Related to Health Services, 1963-2009
Download PowerPoint versions of both figures.
- Department of Commerce. Bureau of Economic Analysis.


