Download PowerPoint versions of both figures.
Inside Collection (Textbook): American Health Economy Illustrated
12.7 Regional Differences in Health Spending Burden Have Narrowed then Increased
Summary: Regional differences in the financial burden of health spending narrowed between 1980 and 1987 but have increased in subsequent years.
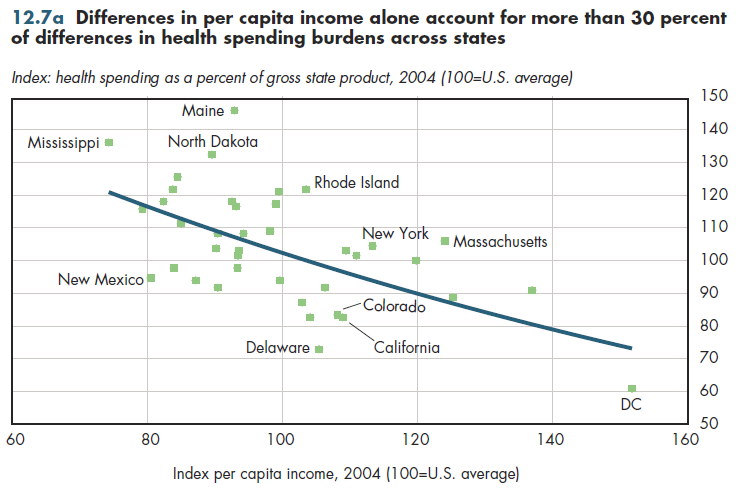
What matters more to citizens and policymakers is the relative burden of health spending rather than its absolute level. An approximate measure of this burden examines state health spending as a share of gross state product (the state equivalent of gross domestic product). In contrast with per capita spending, this measure declines with per capita income (figure 12.7a). That is, the states with the highest per capita incomes tend to have lower health spending burdens. The best-fitting prediction line explains only 37 percent of the differences across states; thus, many other factors must determine the size of any given state's health spending burden. Recall that Mississippi had the lowest health spending per capita, but its relative spending burden is higher than any other state's except Maine.

However, even according to this view, several states in the Northeast region other than Maine have burdens visibly higher than would be predicted from their level of income. Whereas California had a level of per capita spending almost 20 percentage points lower than would be expected from the state's per capita income, its burden is only 10 percentage points lower.
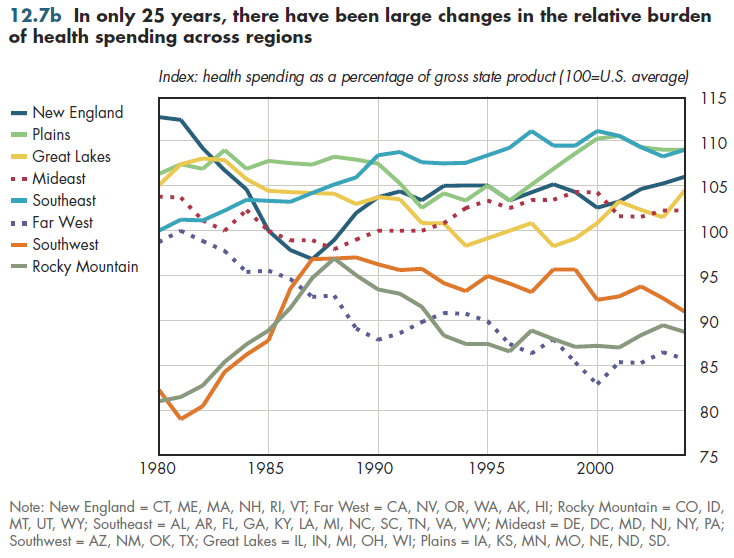
At the regional level, one explanation why New England's per capita health spending grew so high is that it could afford to do so. Although its per capita spending was 22 percent higher than the national average in 2004, its burden was only 6 percent higher (figure 12.7b). Even under this alternative view, the Far West made dramatic gains relative to the nation. Its burden was the same as the national average in 1980 but by 2004 had fallen to 15 percentage points below that average. For the regions as a group, differences declined quickly between 1980 and 1987. In those years, all regions had burdens within 7 percent of the U.S. average.

Subsequently, the spread between the regions has grown to approximately 25 percentage points between the Far West and the Southeast, which has a burden approximately 15 percent above the average.
Downloads
References
- Author's calculations.
- Department of Commerce. Bureau of Economic Analysis.
- Department of Health and Human Services. Centers for Medicare and Medicaid Services.
Collection Navigation
- « Previous module in collection 12.6 Regional Differences in Health Spending per Capita Have Narrowed then Widened
- Collection home: American Health Economy Illustrated
- Next module in collection » 13.1 Millions Are Categorized as Poor because Medical Expenditures Are Not Taken into Account
Content actions
Give feedback:
Download:
Add:
Reuse / Edit:
Twin Cities Campus:
- © 2012 Regents of the University of Minnesota. All rights reserved.
- The University of Minnesota is an equal opportunity educator and employer. Privacy
- Last modified on Sep 26, 2013 1:54 pm -0500


