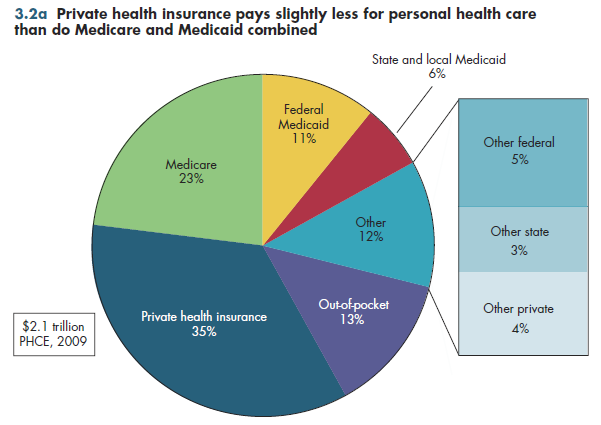
Under the payer view, private health insurance pays for a somewhat smaller share of health spending than do Medicare and Medicaid combined (figure 3.2a). As noted earlier, the Medicare share includes all components paid by Medicare, regardless of source. These include Medicare payroll taxes from all employers (including state and local governments), all premium payments (including premiums paid by state governments under Medicaid for individuals dual-eligible for both programs), and all federal general funds used to finance Parts B, C (managed care plans), and D (prescription drugs).

The federal government also covers approximately two-thirds of Medicaid benefits costs, with state and local governments picking up the balance. When all other federal and state programs for direct health services, such as community health centers, local health departments, and maternal and child health are taken into account, government currently finances slightly less than half of all PHCE.
Private health insurance includes all directly purchased health insurance (non-group plans) and all group plans such as employer-sponsored plans, including plans for public employees and self-insured plans typically offered by large employers. In the latter plans, the employer is at risk for most or all of the costs of health services for plan members. However, health claims under such plans usually are processed by private health insurers or third-party administrators.
Out-of-pocket spending (which includes only payments made at the time of service, but not premium payments for either private or public health insurance) accounts for only 14 percent of spending.
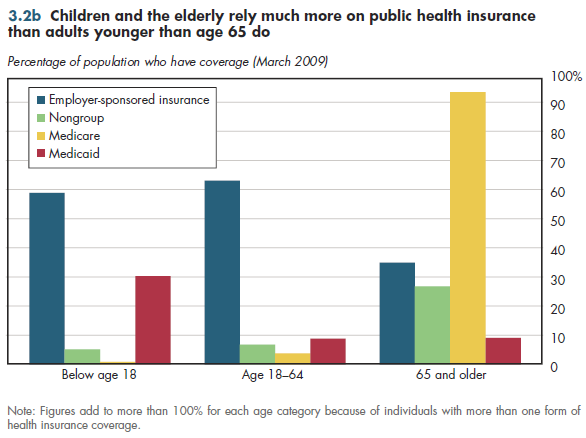
Although Medicare covers more than 90 percent of the elderly, public health plans cover fewer than half of children and younger adults (figure 3.2b). Employer-sponsored insurance covers a majority of both groups. Public insurance — notably Medicaid — is more common for children than for younger adults. In the entire population, Medicare and Medicaid constitute less than 30 percent of coverage (this will increase if health reform is implemented). The large mismatch between shares of spending and population illustrate that public plans already cover many of those who are most sick.

Download Excel workbooks used to create
Figure 3.2a Tables and
Figure 3.2b Tables.
[Note that you’d have separate links for each set of tables] Figures 3.2a and 3.2b were created from the following tables (the workbook includes all supporting tables used to create this table):
- Fig. 3.2a: Table 3.1.1. U.S. Personal Health Expenditures by Source of Funds: 1929 to 2021
- Fig. 3.2b: Table 3.2. Distribution of Health Insurance Coverage by Type and Age, 2011
Download PowerPoint versions of both figures.
- Department of Commerce. Bureau of the Census.
- Department of Health and Human Services. Centers for Medicare and Medicaid Services.


