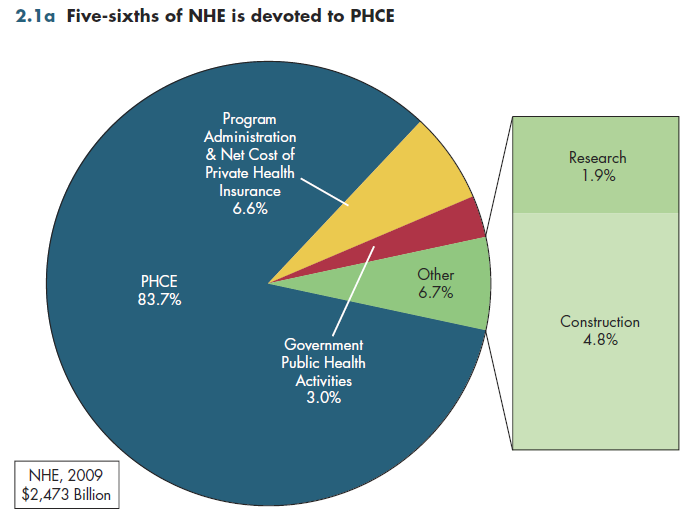
Different methods exist to measure spending for health care. One measure — the NHE — encompasses all private and public spending having to do with health care. However, 1 in 15 dollars of NHE includes what might be regarded as investment, including expenditures for medical research, construction of new facilities, and purchases of new major equipment (figure 2.1a).

Administrative costs associated with public programs such as Medicare and Medicaid, and private health insurance plans, amount to only 1/16 of NHE. This might seem low in light of the purportedly high administrative costs associated with U.S. health care. A main reason is that it excludes large provider-related administrative costs embedded in various health services that make up personal health care expenditures (PHCE).
Government public health activity includes spending for surveillance, inoculations, immunizations and vaccinations, disease prevention activities, and public health laboratories. Currently, fewer than three cents of every health dollar goes to public health. This total should not be interpreted as a measure of all preventive health spending. As with administrative costs, the providers of various health services included under PHCE also engage in clinical preventive services. Public health spending does not capture these costs.
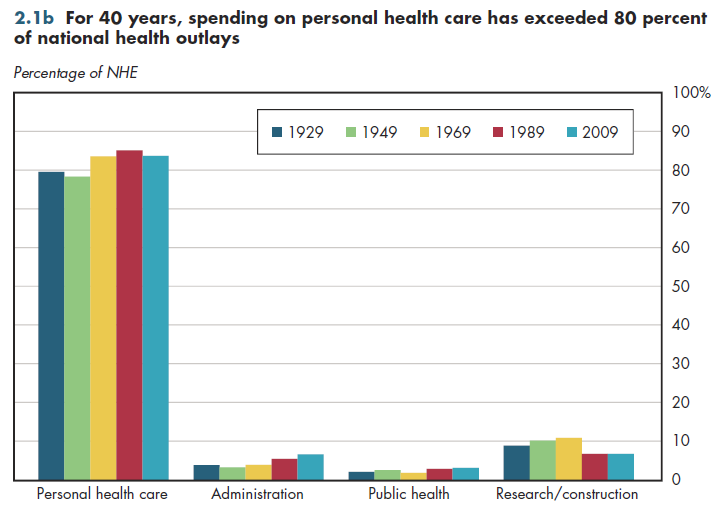
The remainder, PHCE, constitutes 5/6 of all health spending. This includes the full continuum of health care services ranging from primary care through long-term care (for example, nursing homes and home health care). PHCE includes inpatient care (for example, in hospitals, nursing homes, and intermediate-care facilities), and all services by medical professionals (for example, doctors, mid-level practitioners, allied health personnel). Finally, it includes ancillary services such as medical and dental laboratories, medications (prescription and non-prescription), durable medical equipment (for example, wheelchairs), non-durable medical products (for example, bandages), and even medical care provided at worksite clinics. The PHCE share of health spending has exceeded 80 percent of NHE for more than 40 years (figure 2.1b).

Download Excel tables used to create both figures:
Figures 2.1a/2.1b Tables.
Figures 2.1a and 2.1b both were created from the following table (the workbook includes all supporting tables used to create this table):
- Table 2.1. U.S. National Health Expenditures by Type of Expenditure: 1929 to 2021
Download PowerPoint versions of both figures.
- Author's calculations.
- Department of Health and Human Services. Centers for Medicare and Medicaid Services.
- Worthington NL. National Health Expenditures, Calendar Years 1929-73. Research and Statistics Note No 1. Office of Research and Statistics 1975.


