Download PowerPoint versions of figure.
There’s no table for figure since source is included directly on the slide.
Inside Collection (Textbook): American Health Economy Illustrated
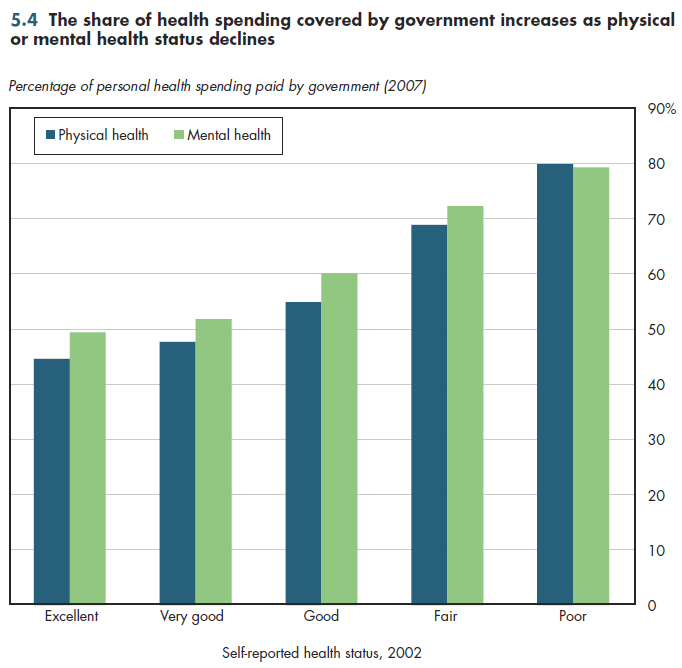
Summary: The public sector pays 80 percent of health costs for people who have poor health.
Approximately 80 percent of health spending by people who have the worst health is tax-financed. This is true whether health status is measured in terms of physical health or mental health. The numbers shown in figure 5.4 are based on self-reported health status, in which individuals categorize their health as Excellent, Very Good, Good, Fair, or Poor. Self-reported health status has been shown to be a good proxy for mental and physical health, using "objective" measures such as the ability to perform activities of daily living (eating, bathing, and so forth).

As shown in figure 5.4, the share of health spending paid by the government rises steadily as health status worsens. This suggests at least some degree of "target efficiency" in terms of focusing public spending on those most in need of medical care. Yet even among those in excellent health, more than 40 percent of health spending is publicly financed. This happens for two reasons. First, Medicare provides near- universal coverage for the elderly, some of whom report excellent health. Although Medicare covers less than half the health spending for a typical person age 65 or older, an important reason for this low percentage is that Medicare was not designed to cover long-term nursing care costs. Among the elderly who have excellent health, nursing home expenses would be minimal; hence, Medicare would finance a higher share of their total annual spending. The second important contributor to this result is that the public spending amounts include tax expenditures such as the subsidy for employer-based health benefits. Given the large fraction of the population who have employer-provided health insurance, this particular subsidy is largely independent of health status. It should not be surprising that many in excellent health benefit from it.
Those who live in families below the poverty level tend to have worse health than those with higher incomes. Nevertheless, many such individuals are in excellent health. However, to the degree that the tax exclusion subsidizes both a higher dollar amount and share of health spending for those who have high incomes and who are in excellent health, the targeting efficiency of taxpayer-financed health spending might be questioned.
Download PowerPoint versions of figure.
There’s no table for figure since source is included directly on the slide.