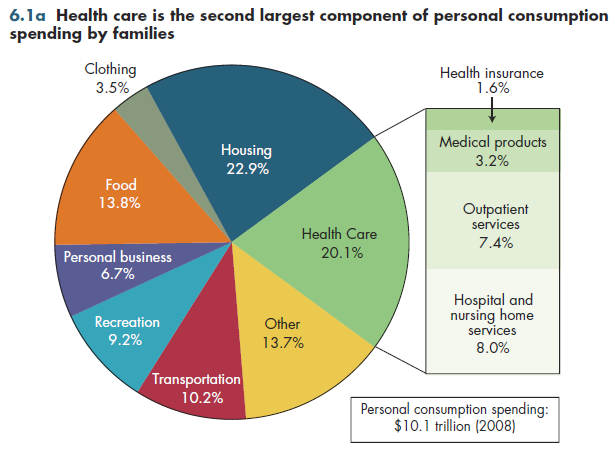
Health care now ranks second in importance in the share of personal consumption spending devoted to it (figure 6.1a). At current rates of change in these shares, health care will overtake housing within five years to become the single largest category of consumption.

Hospitals and nursing homes account for 40 percent of this health care total, but health consumption also includes payments for medical services and products (for example, pharmaceuticals) and the cost of insurance administration (right side of figure 6.1a). Because this category is intended to measure total consumption of health care goods and services, the total includes both out-of-pocket spending and expenditures covered through public or private health insurance.
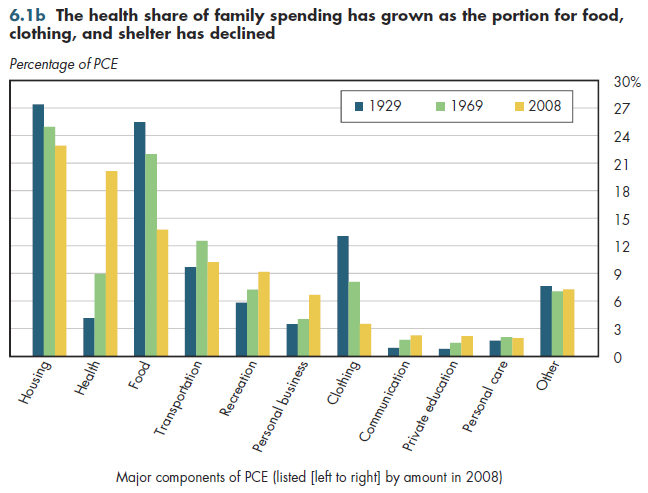
The extraordinary productivity of the American economy over the past 80 years has made the necessities of life far more affordable for the typical family. Before the Great Depression, Americans devoted approximately 65 percent of personal consumption spending solely to food, clothing, and shelter (figure 6.1b). By 2008, such necessities constituted only 40 percent of all household consumption. During the same period, health care's share almost quintupled to 20 percent of all personal consumption.

Briefly, the declining share of family spending on necessities over this period more than made up for the rising share of consumption devoted to health care. Health care is not unique in absorbing an ever-rising share of family spending since 1929, but the aggregate increase in its share is by far the largest. Just in the past 40 years, the health share has more than doubled. No other category of consumption exhibits a relative rise of comparable magnitude.
The rising share of consumption devoted to health care reflects higher incomes, more new and costly medical procedures and drugs, an aging population, and the increasing prevalence of public and private health insurance that weakens most incentives to economize on medical care.
Download Excel tables used to create both figures:
Figures 6.1a/6.1b Tables.
Figures 6.1a and 6.1b both were created from the following table (the workbook includes all supporting tables used to create this table):
- Table 6.1. Distribution of Consumption Expenditures, 1929, 1969, 2008-2012
Download PowerPoint versions of both figures.
- Department of Commerce. Bureau of Economic Analysis.


