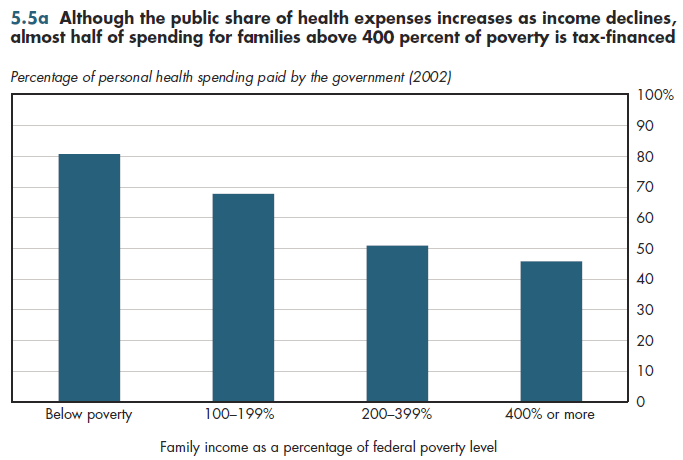
Although more than 80 percent of health spending among those with incomes below poverty is tax-financed, so too is almost half of the spending for families with incomes at four or more times the poverty level (figure 5.5a). As with health status, there is some evidence of target efficiency in terms of greater reliance on public financing for health expenses as family income declines.

Despite major expansions of Medicaid in recent decades, fewer than half of those with incomes below poverty are enrolled in Medicaid or the State Children's Health Insurance Program (SCHIP). Medicaid covers much more than half of health spending for the poor. Many states have "spend-down" programs that permit those with high medical expenses to deduct those from family income for purposes of determining Medicaid eligibility. Consequently, Medicaid covers nearly two-thirds of nursing home patients. Almost 10 percent of the poor are covered by Medicare, which further boosts the share of spending covered by taxpayers. Finally, it was shown previously that a high fraction of health spending among those uninsured all year is uncompensated care—much of which is indirectly paid through taxpayers.
As for the tax exclusion, in a technical sense, individuals at the highest income level pay for themselves. That is, assuming that every dollar of tax expenditures must be offset by a dollar of tax revenue obtained elsewhere, the gross amount of taxes paid by the highest income households to make up this revenue difference will exceed the value of the tax benefit provided by the exclusion. However, especially in the light of the deadweight losses imposed by various forms of taxation, it would be far more efficient to simply let such households pay for their own health benefits directly rather than subsidize these through the tax system. The Office of Management and Budget (OMB) estimates the amount to be at least 25 cents per dollar of taxes collected, but it could be anywhere from 30 cents to more than one dollar, according to other estimates.
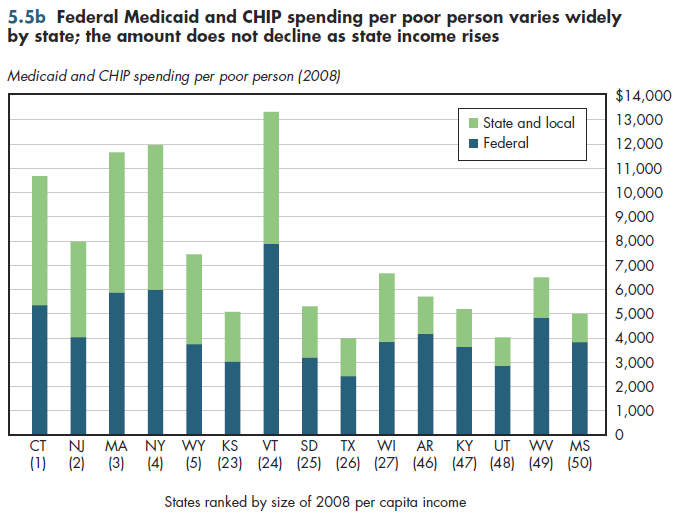
The formula used to determine the federal funding share of Medicaid and the Children's Health Insurance Program (CHIP) takes into account per capita income. Even so, there are wide state-level disparities in Medicaid/CHIP funding per poor person, partly due to higher federal spending per poor person in some of the wealthiest states (figure 5.5b).

Download Excel tables used to create figure:
Figure 5.5b Table.
Figure 5.5b was created from the following table (the workbook includes all supporting tables used to create this table):
- Fig. 5.5b: Table 5.5.2. Medicaid and CHIP Expenditures per Poor Person, 2008 and 2012
There’s no table for Fig. 5.5a since source is included directly on the slide.
Download PowerPoint versions of both figures.
- Seldon TM and M Sing. The Distribution of Public Spending for Health Care in the United States, 2002. Health Affairs Web Exclusive 2008; 27:5w349-w359. http://content.healthaffairs.org/cgi/reprint/27/5/w349 (accessed June 14, 2010).
- Kaiser Family Foundation, The. statehealthfacts.org.


