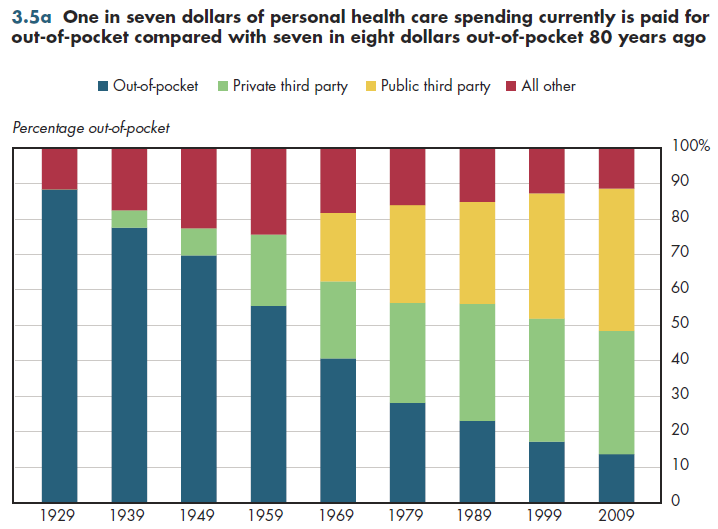
One in seven dollars of personal health care spending now is paid for out-of-pocket compared with seven in eight dollars 80 years ago (figure 3.5a). This by far is the most significant change in health care financing over the past 80 years. Combining all other spending into a single amount, figure 3.5a illustrates quite clearly that the "wedge" of health insurance payments displaced both out-of-pocket and other health spending. This wedge has grown steadily larger each decade.

It is also easy to see that although public insurance and private insurance were approximately equal in amounts as late as 1979, public insurance today accounts for more than 40 percent of spending while private insurance accounts for less than 35 percent. If the recent health plan is implemented, the projected increase in Medicaid enrollees would exceed 30 percent, in which case this differential would grow faster in future years.
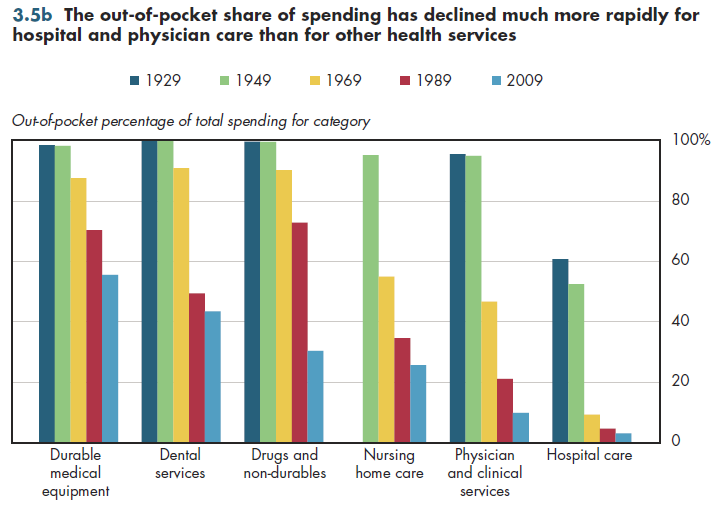
Fig. 3.5b shows how the out-of-pocket share of spending varies by type of service. In 2009, it was highest for durable medical equipment (exceeding 50 percent) and lowest for hospital services (under 5 percent). Even for physician and clinical services, out-of-pocket spending is less than one-tenth of the total. In contrast, more than one-fourth of spending on pharmaceuticals and non-durable medical supplies (e.g., band-aids) and more than one-fifth of nursing home spending is financed out of pocket. Since 1949, the out-of-pocket share of spending has declined much more rapidly for hospital and physician care than for other health services.

The out-of-pocket share of spending might be leveling out. Absent health reform, this share might have begun to increase over time as more employers and individuals switched to high-deductible health plans as a way of lowering premium costs. Health reform is projected to expand coverage to tens of millions of uninsured. Although common sense would require that out-of-pocket expenditures for the newly covered would decline, this is not necessarily the case. On average, per capita out-of-pocket spending for privately insured individuals is approximately 15 percent higher than it is for people who are uninsured all year. Counterbalancing this, however, are provisions in the new law that will set an income-related ceiling on out-of-pocket spending and various expansions in coverage such as prohibiting cost-sharing for preventive services and eliminating lifetime limits on coverage.
Download Excel tables used to create
Figures 3.5a/3.5b Tables.
Figures 3.5a and 3.5b were created from the following table (the workbook includes all supporting tables used to create this table):
- Fig. 3.5a: Table 3.1.1. U.S. Personal Health Expenditures by Source of Funds: 1929 to 2021
- Fig. 3.5b: Table 3.5. U.S. Out-of-Pocket Expenditures by Type of Expenditure: 1929 to 2021
Download PowerPoint versions of both figures.
- Author's calculations.
- Department of Health and Human Services. Centers for Medicare and Medicaid Services.
- Worthington NL. National Health Expenditures, Calendar Years 1929-73. Research and Statistics Note No 1. Office of Research and Statistics 1975.


