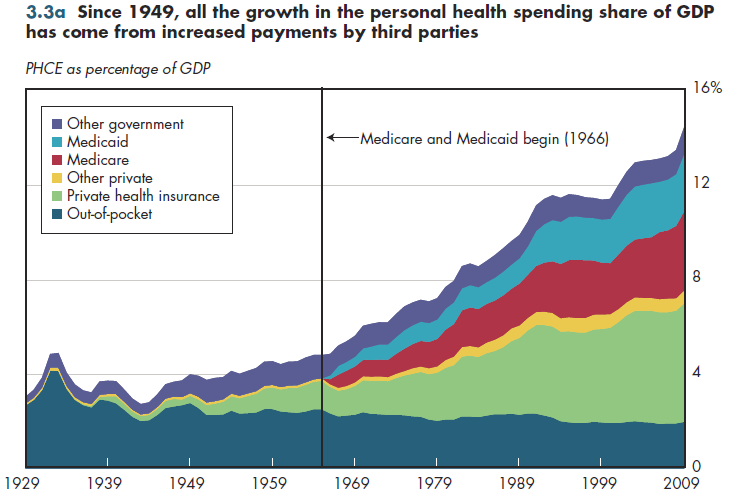
Health spending as a percentage of GDP has more than tripled since 1949 (figure 3.3a). The share of GDP paid through out-of-pocket health spending has declined steadily during this same period (except in a handful of years). The growing share of expenditures paid by private insurance and public insurance has bankrolled the entire increase in the health sector share of the economy during this time.

There was little private insurance in 1929, but it grew rapidly after World War II. This was fueled by an IRS decision (later codified into law) that employer-provided fringe benefits (including health insurance) would not be taxable. Thus, a dollar of employer-paid health insurance was more valuable to the employee than a dollar of wages from which taxes were deducted. In 1965, Medicare and Medicaid displaced what might have been continued growth in private insurance, as shown in figure 3.3a. In fact, for several years in the late 1960s, the private insurance share of GDP declined slightly. Even so, this share more than tripled between 1969 and 2009.
Spending on other government programs also declined slightly with the introduction of public health insurance coverage. This makes sense insofar as Medicaid in particular replaced many state and local programs that had provided direct medical services to indigent individuals. Even so, such other government spending subsequently grew for a period before declining rather steadily until today.
At a more fine-grained level, Medicare grew in size somewhat more rapidly than did Medicaid, while growth in Medicaid slightly outpaced the rate of growth in private insurance.
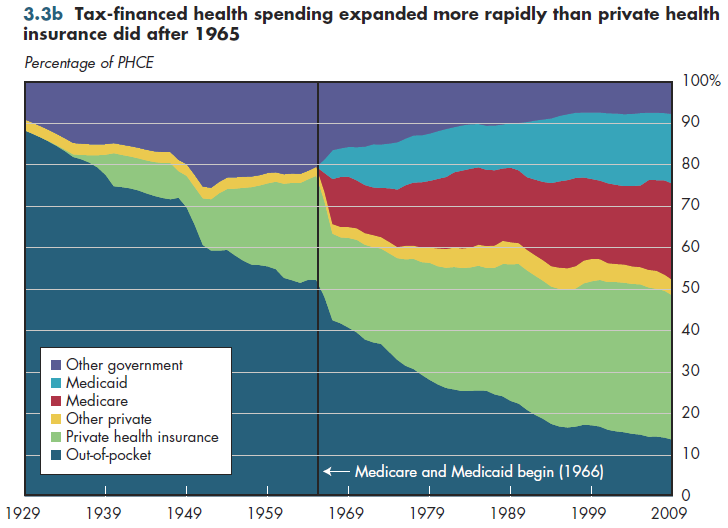
An alternative view of the same data shows more clearly how public spending grew as a share of personal health spending after World War II, but subsequently was eclipsed in importance by the rapid rise of private health insurance (figure 3.3b). However, this explosion in private health insurance also halted temporarily, starting in 1966 when both Medicaid and Medicare began. Even so, within a few years, although the Medicaid and Medicare shares of spending continued to grow, the role of private health insurance also began to increase.

Download Excel tables used to create both figures:
Figures 3.3a/3.3b Tables.
Figures 3.3a and 3.3b both were created from the following table (the workbook includes all supporting tables used to create this table):
- Table 3.3. U.S. Personal Health Expenditures by Selected Source of Funds: 1929 to 2021
Download PowerPoint versions of both figures.
- Author's calculations.
- Department of Commerce. Bureau of Economic Analysis.
- Department of Health and Human Services. Centers for Medicare and Medicaid Services.
- Worthington NL. National Health Expenditures, Calendar Years 1929-73. Research and Statistics Note No 1. Office of Research and Statistics 1975.


