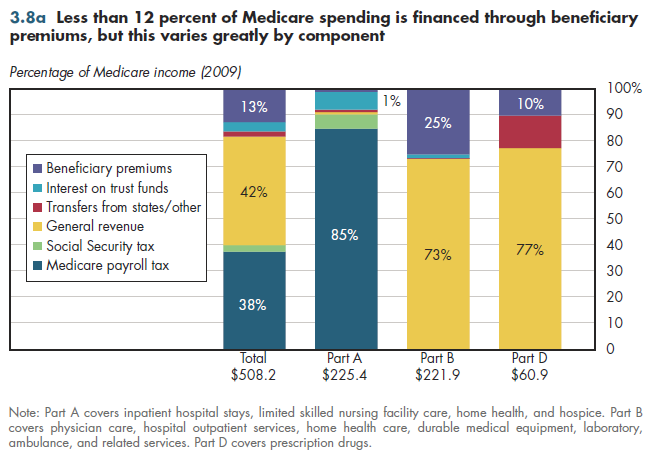
Recall that Medicare is the nation's single largest program financing medical care in the United States, with more than one-half trillion dollars in spending in 2009 (figure 3.8a). Most people think of Medicare as being supported primarily through payroll taxes (1.45 percent each, for employers and employees). Currently, however, a larger share of Medicare is paid with federal general revenues than from payroll contributions. The payroll taxes are used exclusively to finance Medicare Part A, which covers inpatient hospital stays, limited skilled nursing facility care, home health, and hospice.

By law, beneficiary premiums cover 25 percent of the costs of Part B, which covers physician care, hospital outpatient services, home health care, durable medical equipment, laboratory, ambulance and related services. The lion's share of remaining expenses is covered from general fund revenue. Part D covers prescription drugs. Beneficiary premiums cover only 10 percent of its costs, with more than 75 percent paid by the federal general fund (the remainder is from state government transfers). Thus, for the Medicare program as a whole, less than one dollar in eight is financed from premium payments made by beneficiaries. The remainder is tax-financed.
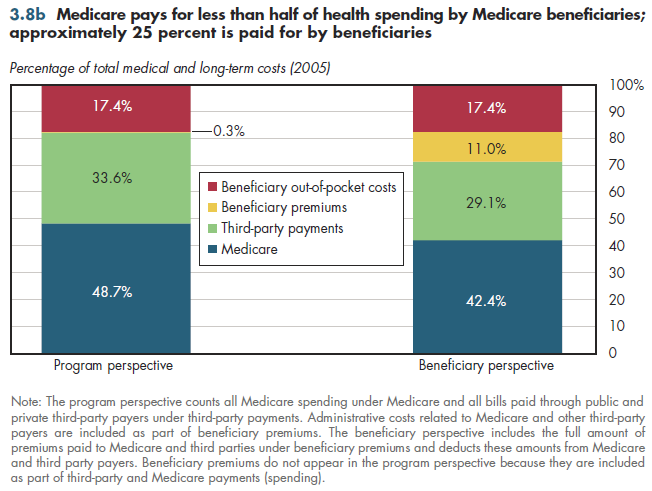
Despite its size, Medicare covers less than half of annual medical and long-term care costs for the average beneficiary (figure 3.8b, left bar). However, from a beneficiary perspective, some of those Medicare payments are financed by beneficiary-paid premiums; the same is true for private third-party coverage. Yet even from this perspective, beneficiaries pay only approximately 25 percent of annual costs, including amounts paid out-of-pocket for medical services and the amounts that beneficiaries pay in voluntary premiums for Parts B and D and supplemental insurance ("Medigap" policies and employer-sponsored health plans).

The remaining expenses are covered by third-party payers. These expenses include Medicaid coverage for so-called "dual eligibles" (whose spending is more than double that of other beneficiaries), private supplemental Medigap policies (held by 25 percent of enrollees), and group health coverage for retirees (held by almost 30 percent of beneficiaries).
Download Excel tables used to create
Figures 3.8a/3.8b Tables.
Figures 3.8a and 3.8b were created from the following table (the workbook includes all supporting tables used to create this table):
- Fig. 3.8a: Table 3.8.1. Distribution of Medicare Income by Source of Revenue, 2009
- Fig. 3.8b: Table 3.8.2. Distribution of Medicare Costs per Beneficiary by Source of Revenue, 2005 and 2006
Download PowerPoint versions of both figures.
- Author's calculations.
- Boards of Trustees, Federal Hospital Insurance and Federal Supplementary Medi- cal Insurance Trust Funds, The. 2010 Annual Report. US Government Printing Office. August 5, 2010.
- Potetz L and J Cubanski. A Primer on Medicare Financing. July 2009. http://www.kff.org/medicare/upload/7731-02.pdf (accessed August 10, 2010).
- Seldon TM and M Sing. The Distribution of Public Spending for Health Care in the United States, 2002. Health Affairs Web Exclusive 2008; 27:5w349-w359. http://content.healthaffairs.org/cgi/reprint/27/5/w349 (accessed June 14, 2010).
- Sherlock DB. Administrative Expenses of Health Plans. Prepared for the Blue Cross Blue Shield Association. http://www.bcbs.com/issues/uninsured/Sherlock- Report-FINAL.pdf (accessed February 2010).


