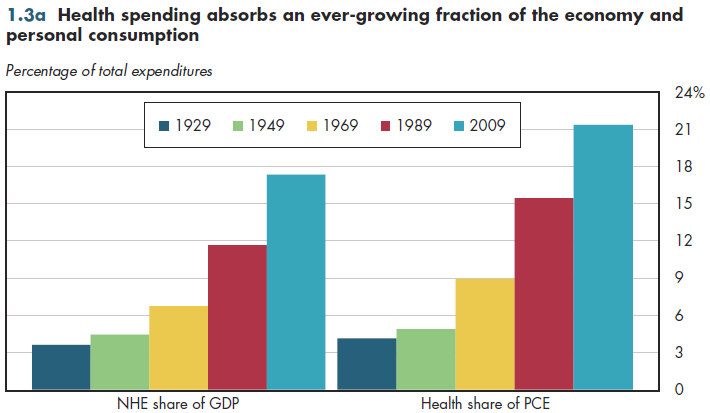
The percentage of GDP devoted to health care has more than quadrupled during the past 80 years to more than one-sixth of the entire economy. Indeed, health spending has grown faster than almost all other major components of the economy. Thus, an alternative way of assessing long-term trends in the size of the health sector is by examining how the health care share of national output and some of its largest basic parts have grown over time.
PCE accounts for approximately 70 percent of GDP. Thus, changes in the fraction of PCE devoted to health care (including spending for health insurance) mirror the general pattern observed for GDP. However, the health share of PCE is consistently larger than the fraction of GDP attributable to health care: It now exceeds 20 percent
(figure 1.3a).

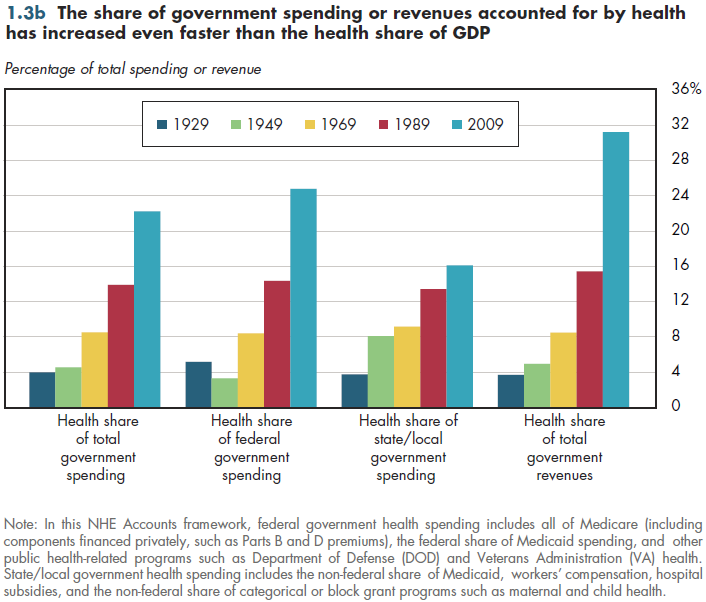
Moreover, a growing share of health care is financed by government at all levels. Consequently, the percentage of public sector spending having to do with health care has risen even faster than in the general economy or in total consumption (figure 1.3b). However, viewing aggregate health spending across all levels of government masks a sizable difference in trends at the federal government level compared with state and local governments—especially since the introduction of Medicare and Medicaid in 1966. Health spending now makes up 25 percent of all federal spending compared with only one-sixth of total spending by state and local governments. As of 1969, the health share of non-federal government spending still slightly exceeded the share of government spending at the federal level. These initial comparisons provide a broad view of the size and direction of expenditure trends (chapter 3 provides detailed public spending).

Before 1969, there was not a big difference between health care's share of public spending or public revenue. However, because deficit financing has become an enduring feature of the federal budget in recent decades, measuring health spending against government revenues shows an even more dramatic rate of growth in the past 40 years. Health care now absorbs almost one in three tax dollars — a share that is more than eight times as large as it was in 1929. Considering only federal revenues, this share would be even more.
Download Excel tables used to create both figures:
Figures 1.3a/1.3b Tables.
Figures 1.3a and 1.3b both were created from the following table (the workbook includes all supporting tables used to create this table):
- Table 1.3. Health Expenditures as a Share of U.S. GDP, Federal Outlays, State and Local Government Outlays: 1929 to 2021
Download PowerPoint versions of both figures.
- Author's calculations.
- Department of Commerce. Bureau of Economic Analysis.
- Department of Health and Human Services. Centers for Medicare and Medicaid
Services.
- Worthington NL. National Health Expenditures, Calendar Years 1929-73.
Research and Statistics Note No 1. Office of Research and Statistics 1975.


