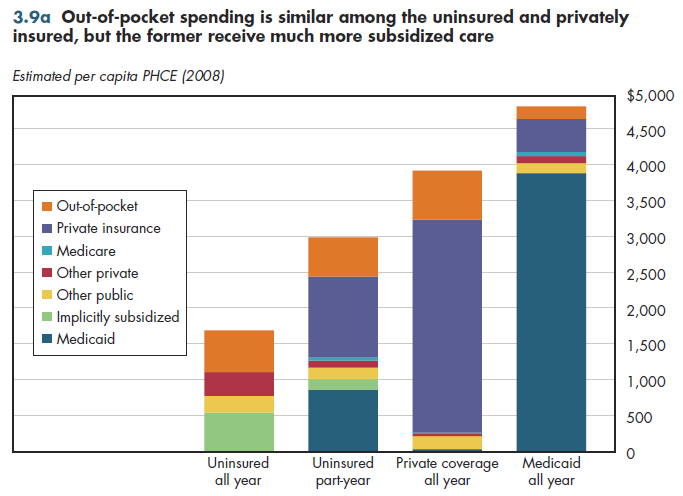
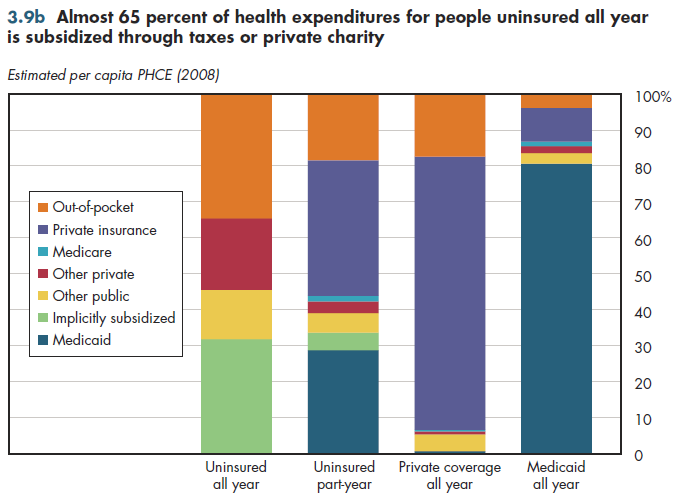
In absolute dollars, per capita out-of-pocket health spending is similar among those uninsured all year, those uninsured part-year, and those with year-round private health insurance coverage (figure 3.9a). This might seem counterintuitive, but it reflects the fact that the typical individual with private coverage has a higher income and hence willingness-to-pay for medical goods and services. Among children (where the age distribution is quite similar), total spending is approximately 80 percent higher among those with private coverage compared with individuals uninsured the entire year.

In figures 3.9a and 3.9b, implicitly subsidized care represents the cost of care indirectly subsidized by hospitals, physicians, and other providers. Other public care includes payments by the Veterans Health Administration (VHA), CHAMPUS-TRICARE (for civilian dependents of military personnel), workers' compensation, and other federal, state, and local public programs that pay directly for care (for example, maternal and child health). Thus, it combines subsidized care to individuals lacking the means to pay, with care to which one might be entitled (for example, work injury). Likewise, other private includes unsubsidized care (for example, payments from accident, automobile, and indemnity policies), and care that likely is subsidized, such as private philanthropy and cash payments by non-family members.

The per capita amount of non-Medicaid subsidized care is highest among those uninsured all year, followed by the part-year uninsured and the privately insured. Because the part-year uninsured lack coverage for approximately six months, their annual spending includes some care paid through public and private health plans. If Medicaid is included as a form of subsidized care, those who are uninsured part of a year actually receive more subsidized services than do those without coverage the entire year.
Viewing the same data in terms of shares of spending provides a different result. For the all-year uninsured, at least 30 percent but no more than 65 percent of spending is subsidized (figure 3.9b). In contrast, such sources pay for only approximately 10 to 13 percent of annual spending for the part-year uninsured. However, if Medicaid were counted as subsidized care, this would add almost 30 percentage points to the total for this group.
Download Excel tables used to create both figures:
Figures 3.9a/3.9b Tables.
Figures 3.9a and 3.9b both were created from the following table (the workbook includes all supporting tables used to create this table):
- Table 3.9. Sources of Payment for Patients, by Insurance Status, 2008
Download PowerPoint versions of both figures.
- Hadley J, J Holahan, T Coughlin and D Miller. Covering the Uninsured in 2008: A Detailed Examination of Current Costs and Sources of Payment, and Incremental Costs of Expanding Coverage. Prepared for the Kaiser Commission on Medicaid and the Uninsured. Kaiser Commission on Medicaid and the Uninsured. Washington DC. August 2008.


