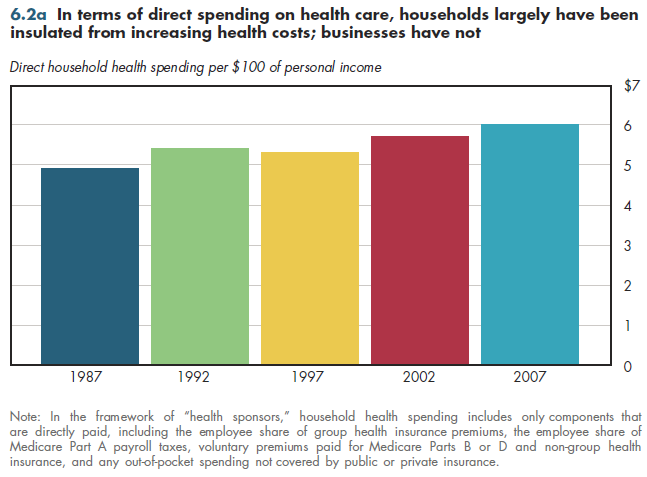
Only 5 percent of family income pays directly for health care in the form of the worker share of group health premiums and Medicare Part A payroll taxes, voluntary premiums paid for non-group health insurance, Medicare Parts B and D, and out-of-pocket medical expenses not covered by insurance. Thus, even though health care now accounts for more than 20 percent of personal consumption spending, this greatly exaggerates the visibility of health expenditures in a typical family's budget.
Careful studies have demonstrated that most or all of the cost of employer-paid health premiums actually is borne by workers in the form of lower wages or other forms of fringe benefits. The same logic applies to the 1.45 percent payroll tax paid directly by employers for Medicare Part A (separate from the matching "employee share" that workers see deducted from paychecks). Many (possibly most) workers might not realize this insofar as employer-paid health costs—including workers' compensation or employer-funded on-site health clinics—generally are invisible to them.
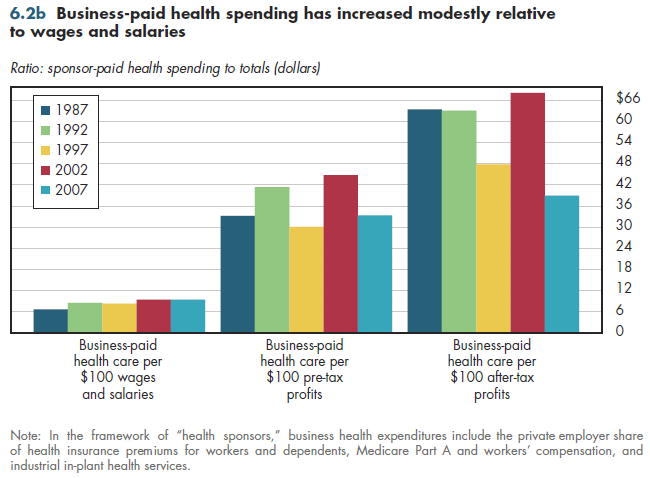
Relative to payroll, these directly paid private employer-paid health expenses have risen steadily for decades; even so, such costs are less than $10 for every $100 of private wages and salaries (figure 6.2a). In contrast, when compared with pre-tax profits, the ratio of health spending to profits is lowest when the economy is growing and highest during economic recoveries such as in 1992. This pattern is less pronounced in the ratio of business-paid health costs to after-tax profits, which at times has been as high as $60 to $70 per $100 of profits. Yet by 2007, this ratio had declined sharply to less than $40 per $100 of profits after taxes.


Download Excel tables used to create both figures:
Figures 6.2a/6.2b Tables.
Figures 6.2a and 6.2b both were created from the following table (the workbook includes all supporting tables used to create this table):
- Table 1.3.8. U.S. National Health Expenditures, by Private Sponsor: 1987 to 2021
Download PowerPoint versions of both figures.
- Author's calculations.
- Department of Health and Human Services. Centers for Medicare and Medicaid Services.


