Uncertainty is pervasive in long-term forecasts of health spending. An approach called "stochastic modeling" is used by Medicare Trustees and other analysts to try to quantify the extent of that uncertainty.
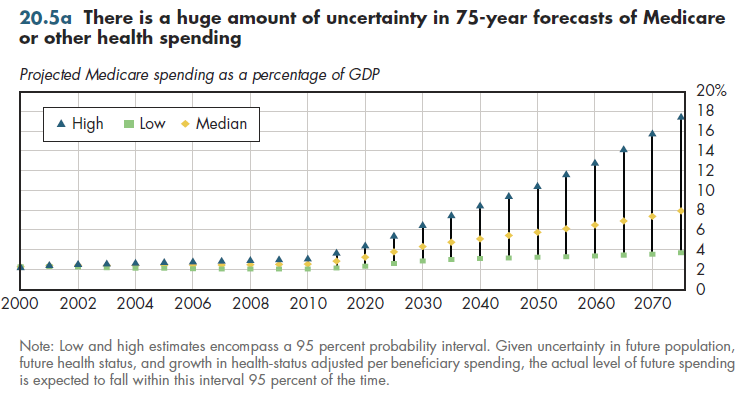
Because perfect prediction is impossible, the goal of analysts is to identify some boundaries within which the true value of future spending is likely to lie. A 95 percent probability interval (also termed a confidence interval) is a typical approach to articulating these boundaries. Given uncertainty in future population, health status, and growth in health-status-adjusted per-beneficiary spending, the actual level of future spending is expected to fall within such an interval 95 percent of the time. There is more than a four-to-one ratio between the estimated Medicare share of GDP at the top of this interval compared with the bottom (figure 20.5a).

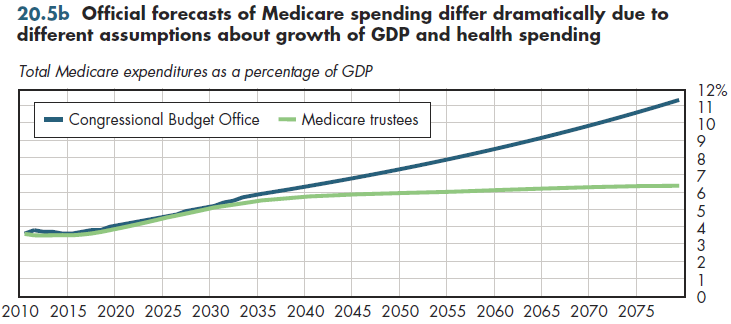
Even official forecasts of Medicare spending vary dramatically. In its 2010 annual report, the Medicare Trustees predicted that total Medicare spending in the year 2080 would be 6.4 percent (figure 20.5b). The CBO, using different assumptions about growth in GDP and growth in Medicare spending, concluded that Medicare by 2080 would account for 11 to 12 percent of GDP. Which prediction is "true" is less important than understanding that even highly skilled experts using reasonable variations in assumptions can produce widely disparate estimates of 75-year costs. Even a seemingly small difference in assumptions (for example, GDP will grow 0.1 percent more slowly) accumulates into a vast difference when compounded over decades.

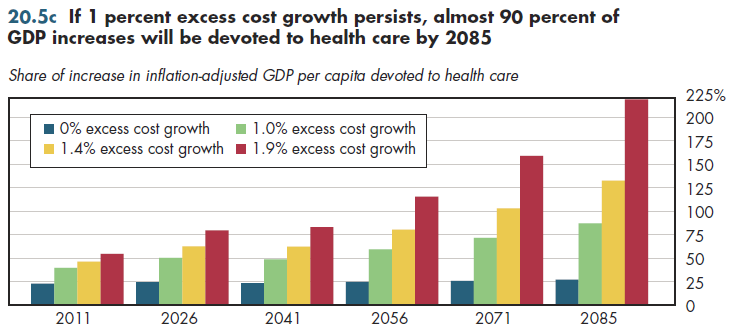
All the official forecasts assume a decline in the excess cost growth rate over the 75-year projection period. After 75 years, the Trustees assume that excess cost growth will be zero, that is, that Medicare will grow at the same pace as the general economy. The CBO, in contrast, assumes that excess cost growth for all other components of health spending (including Medicaid, CHIP, and exchange subsidies) will be zero, but that the excess cost growth for Medicare in 2085 still would be one percentage point. Were excess cost growth of one percentage point to continue for the entire health system, it would imply that by 2085, 90 cents of every extra dollar of GDP would flow into the health system (figure 20.5c).

Download PowerPoint versions of all figures.
- Author's calculations.
- Boards of Trustees, Federal Hospital Insurance and Federal Supplementary Medical Insurance Trust Funds, The. 2010 Annual Report. US Government Printing Office. August 5, 2010.
- Congressional Budget Office.
- Lee R and T Miller. An Approach to Forecasting Health Expenditures, with Application to the US Medicare System. Health Services Research 2002; 37(5):1365-86.


