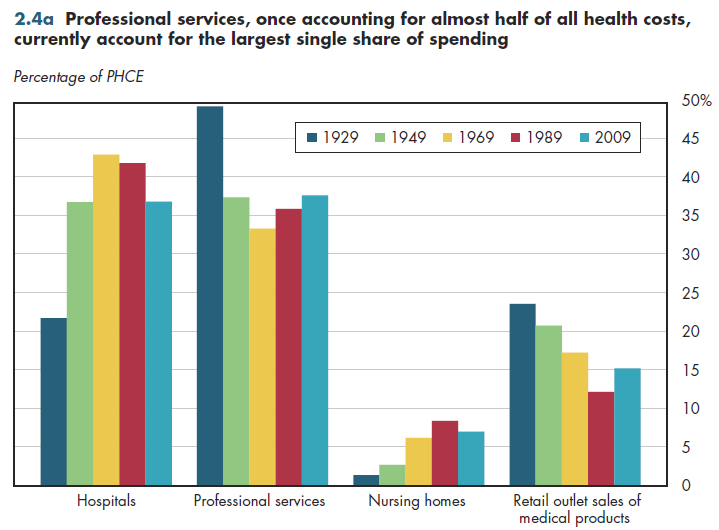
The dominance of health facilities during the 1960s through 1980s has given way to a shift toward outpatient care in recent decades. Hospital care accounted for just slightly more than 20 percent of PHCE in 1929, but this share peaked at 48 percent in 1982 and has declined to less than 40 percent today (figure 2.4a). Nursing home care accounted for only slightly more than a penny per PHCE dollar in 1929, but this amount peaked in 1998 at 8.9 cents, after which it now has declined to seven cents. Combined "institutional" spending on hospitals and nursing homes was less than 25 percent of spending in 1929, but it too peaked at 56 cents per dollar of PHCE in 1982, declining to approximately 44 cents today.

The services of health professionals, in contrast, declined from almost half of all spending in 1929 to a low of 31 cents per PHCE dollar in 1982, followed by a subsequent rise to 38 percent. Medicare began paying a flat rate per hospital stay that varied based on a patient's diagnosis in 1983. This so-called prospective payment system (PPS) provided a strong incentive to discharge patients early, resulting in a sizable decline in hospital use among the elderly in the years that followed.
Sales of non-durable medical products such as band-aids declined steadily from almost 25 percent of PHCE in 1929 to slightly more than 10 percent by 1989, but then rose to 15 percent by the year 2009. In contrast to the other medical services shown, where pricing often is far from transparent and health insurance coverage far more common, these medical products generally are sold in retail outlets such as drugstores or grocery stores, where pricing is transparent and competition fierce.
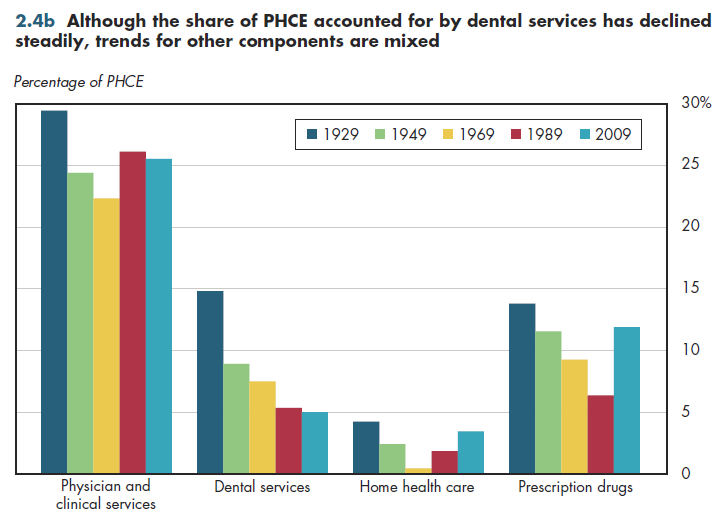
Although physician and clinical services hovered for decades at approximately 25 percent of PHCE, the dental services share of spending declined steadily (figure 2.4b). Although dental insurance coverage has expanded gradually, the out-of-pocket share of dental care is more than four times the corresponding share (less than 10 percent) of physician and clinical services that is not financed through third-party payers. Similarly, 60 percent of pharmaceuticals were paid for out-of-pocket as of 1988, compared with 20 percent by 2009. This helps explain the patterns shown.

Download Excel tables used to create both figures:
Figures 2.4a/2.4b Tables.
Figures 2.4a and 2.4b both were created from the following table (the workbook includes all supporting tables used to create this table):
- Table 2.1. U.S. National Health Expenditures by Type of Expenditure: 1929 to 2021
Download PowerPoint versions of both figures.
- Author's calculations.
- Department of Health and Human Services. Centers for Medicare and Medicaid Services.
- Worthington NL. National Health Expenditures, Calendar Years 1929-73. Research and Statistics Note No 1. Office of Research and Statistics 1975.


