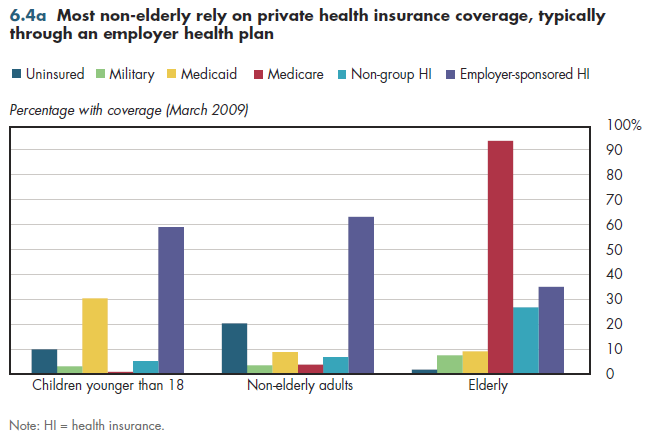
Approximately 60 percent of non-elderly adults and children rely principally on employer-provided coverage (figure 6.4a). In contrast, those 65 and older rely extensively on Medicare, although many also have supplemental private insurance through an employer or a policy that is directly purchased.

Medicaid covers much of the residual gap in coverage for children, but plays a much smaller corresponding role for non-elderly adults. Adults are twice as likely to be uninsured, even though they have somewhat higher rates of coverage for non-group, military, and Medicare compared with coverage for children.
More than nine of every 10 elderly are covered by Medicare. Medicare Part A (predominantly hospital and nursing home care) is provided at no cost to those qualifying for Social Security. Medicare Part B (predominantly physician and home health care) and Medicare Part D (prescription drugs) require the payment of premiums. These premiums amount to approximately one-fourth of the cost of Parts B and D benefits. All components also have patient cost-sharing in the form of deductibles and copayments. The percentage covered by Medicaid is almost identical for non-elderly and elderly adults, but almost all of the latter group are so-called "dual eligible." This means that they also qualify for Medicare; thus, Medicaid covers all or some of their premium payments and cost-sharing obligations. Fewer than 2 percent of the elderly are uninsured.
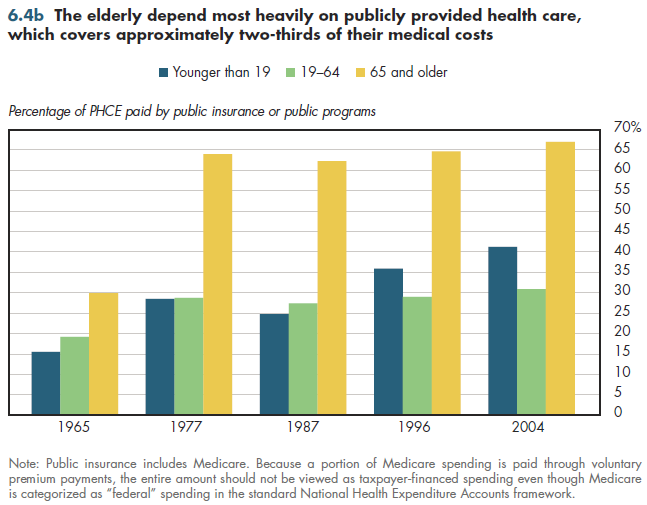
Public programs finance 65 percent of health spending by the elderly and 40 percent of expenditures for children (figure 6.4b). In contrast, the public program share of health spending for adults younger than age 65 is less than half that of the aged. Data for all the years shown are not available, but in 2007, Medicaid covered 75 percent of the tax-financed amount of medical care provided to children. In contrast, for the elderly, Medicare financed 75 percent of the public spending for health care.

Taking into account the hidden tax expenditures discussed previously, public programs finance more than half of health spending for both children and non-elderly adults—considerably narrowing the gap between these two groups and the elderly.
Download Excel workbooks used to create
Figure 6.4a Table and
Figure 6.4b Table.
[Note that you’d have separate links for each set of tables] Figures 6.4a and 6.4b were created from the following tables (the workbook includes all supporting tables used to create these tables):
- Fig. 6.4a: Table 6.4.1. Health Insurance Coverage, by Age, March 2009
- Fig. 6.4b: Table 6.4.2. Per Capita Personal Health Expenditures, by Age, Selected Years
Download PowerPoint versions of both figures.
- Department of Commerce. Bureau of the Census.


