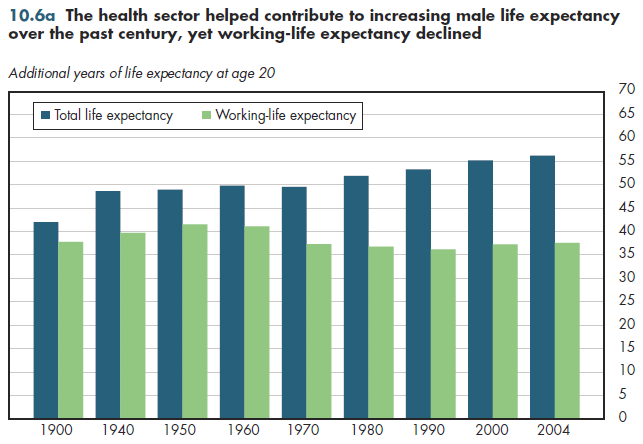
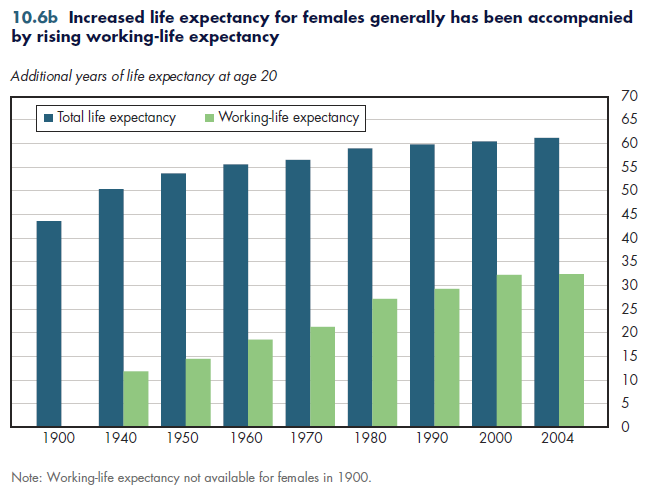
Since 1900, male life expectancy at age 20 has risen by 14 years, yet working-life expectancy currently is lower than it was when Theodore Roosevelt first was elected president. Working-life expectancy for men generally declined slowly but steadily starting in 1950, although it has increased slightly since 1990.
A baby born in 1900 had a life expectancy of only 47 years. A baby born in 2007 has a life expectancy of 77.9 years. The health sector cannot take credit for this entire 30-year increase in life expectancy. Public health measures such as improved sanitation and clean drinking water surely played a role. For the same reason, everyone believes that the rapid growth in the health care sector in the United States contributed to these remarkable gains in years of life.
At the start of the last century, a man age 20 could expect to live an additional 42 years, during which he could expect to work 38 years (figure 10.6a). The period of retirement was thus short. By 2004, life expectancy for a typical 20-year-old man had climbed to 56 years, yet his expected working-life expectancy still was 38 years! With a longer life expectancy and no change in working-life expectancy, the expected duration of retirement rose to 18 years, a considerable increase over four years a century earlier. Another way to look at this is to consider that in 1900, a man surviving to age 20 could expect to work 90 percent of his remaining life; by 2004, that share was less than 65 percent.

Women have a different course. Female life expectancy has risen even more than for men over the same period—from 44 to 61 years for a woman age 20 (figure 10.6b). Working-life numbers for women also rose more rapidly, as women's participation in the labor force has increased. In 1940, the average woman at age 20 could expect to be actively working in paid employment for only 12 years—less than 25 percent of her remaining years of life. This was 28 years fewer than the comparable number for men. By 2004, this male-female difference had decreased to only five years.

Despite these changes, men today have 11 more working years than women do. Women spend far more time in paid employment than a century ago, but such work accounts for only approximately half of their adult lives.
Download PowerPoint versions of both figures.
Download Excel tables used to create
Figures 10.6a/10.6b Tables.
Figures 10.6a and 10.6b were created from the following tables (the workbook includes all supporting tables used to create this table):
- Fig. 10.6a: Table 9.6.1. Table 10.6. Life and Working-Life Expectancies for Males and Females At Age 20, 1900-2009
- Fig. 10.6b: Table 9.6.2. Table 10.6. Life and Working-Life Expectancies for Males and Females At Age 20, 1900-2009
- Chiecka J, T Donley and J Goldman. Work Life Estimates at Millennium's End: Changes over the Last Eighteen Years. Illinois Labor Market Review 2000; 6(2). http://lmi.ides.state.il.us/lmr/worklife.htm (accessed June 30, 2010).
- Department of Health and Human Services. Centers for Disease Control and Prevention.
- Department of Labor. Bureau of Labor Statistics.
- Krueger KV, GR Skoog and JE Ciecka. Worklife in a Markov Model with Full-time and Part-time Activity. Journal of Forensic Economics 2006; 19(1):61-82. http://legaleconometrics.com/P19_JFE8.pdf (accessed June 30, 2010).
- Smith SJ. New Worklife Estimates Reflect Changing Profile of Labor Force. Monthly Labor Review March 1982:15-20. http://www.bls.gov/opub/mlr/1982/03/art2 full.pdf (accessed June 30, 2010).


