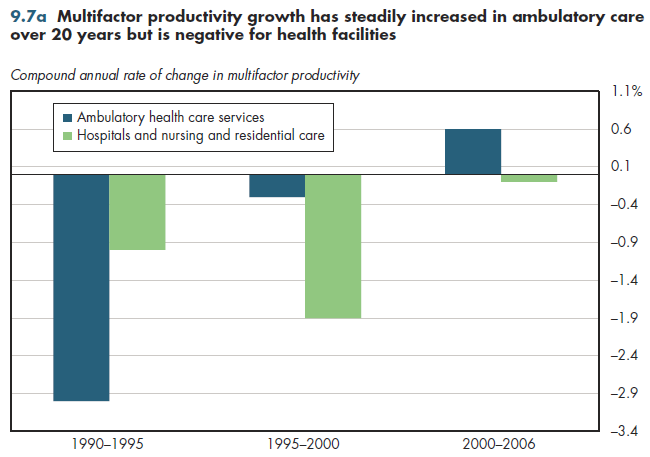
For much of the past 20 years, overall productivity growth has been negative for ambulatory health care and health facilities. Only in the last decade has multifactor productivity increased slightly in the ambulatory health services sector (figure 9.7a). Various factors of production such as labor, capital, and even information capital are discussed previously in this chapter. However, other inputs into the production process affect the level of output that is attainable. These include energy, materials, and purchased services (for example, legal services), among others. The various inputs are combined, based on their relative contribution to the cost of production. Thus, the net increase in inputs essentially is a weighted average of changes in all the various factors of production. For example, conceivably, efficiency improvements in the energy sector would result in a net decrease in energy inputs required to produce a unit of health output. Thus, the multifactor measure of inputs would have to combine negative growth in energy inputs with positive increases in other factors of production.

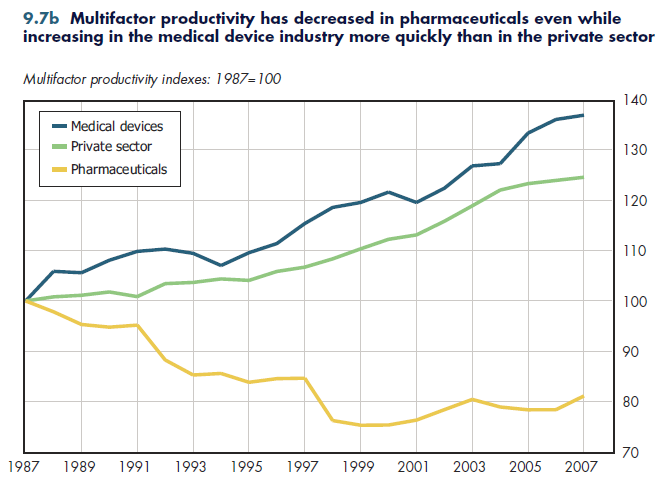
Viewed from this perspective, multifactor productivity generally has been declining in the pharmaceutical industry during the past 20 years (although this might have reversed itself since 1998). In sharp contrast, multifactor productivity in the medical device industry has grown by more than 30 percent during this period. This productivity outpaced the rate of increase in multifactor productivity in the private sector (figure 9.7b).

These disparate trends reinforce a general point that should have been increasingly clear as this chapter has evolved. The health industry comprises several subsectors that vary greatly in terms of the relative importance of labor, capital, and other factors of production, but also in terms of the degree that changes in such factors contribute to changes in overall output. The goods-producing portions of health care typically are different from the services-producing health industries. Even within the health services sector, health facilities are different from the components of ambulatory health services in terms of various productivity trends. This makes it difficult to generalize about the health industry as a whole.
Download PowerPoint versions of both figures.
Download Excel workbooks used to create
Figure 9.7a Table and
Figure 9.7b Table.
[Note that you’d have separate links for each set of tables] Figures 9.7a and 9.7b were created from the following tables
(the workbook includes all supporting tables used to create these tables):
- Fig. 9.7a: Table 9.7.1. Multifactor Productivity Growth in Health, Legal and Educational Services, Compound Annual Rates of Change, 1987-2006
- Fig. 9.7b: Table 9.7.2. Productivity Trends for Pharma, Medical Devices and Total Private Business, 1987-2007
- Author's calculations.
- Department of Labor. Bureau of Labor Statistics.
- Harper MJ, B Khandrika, R Kinoshita and S Rosenthal. Nonmanufacturing industry contributions to multifactor productivity, 1987-2006. Monthly Labor Review 2010; June:16-31.


