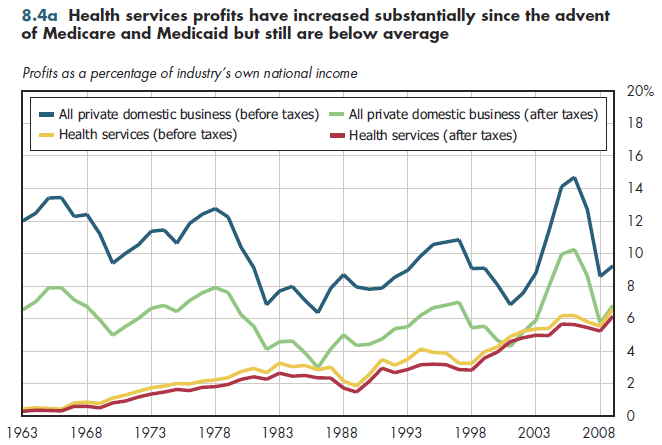
After-tax corporate profits for health services now exceed $58 billion. This is a large number in absolute terms but accounts for only 6.1 percent of health services-related national income. The share of such income accounted for by profits has grown considerably since 1963, when both pre-tax and after-tax profits were less than 0.5 percent of health care's national income (figure 8.4a).

These numbers reflect the growing share of health services provided by for-profit organizations and the declining share of health-related national income accounted for by proprietors' and rental income. These numbers do not include profits in pharmaceuticals or medical devices, or they assuredly would be higher.
Corporate profits in most of the rest of the economy tend to be highly sensitive to changing business conditions. Little evidence of parallel fluctuations in health services profits exists. The decline in profits starting in 1983, for example, occurred after the deep recession of 1981-1982 had ended. It can be attributed to the introduction of the Medicare PPS for hospitals, which limited payments to a fixed amount that varied by diagnosis. In contrast to the earlier cost-based reimbursement system, PPS forced hospitals to economize by limiting lengths of stay and reducing the intensity of care per admission.
Likewise, much of the downturn in profits starting in 1997 is likely caused by the Balanced Budget Act of 1997 (BBA97), which included the largest cuts in Medi- care's history. BBA97 included payment cuts for hospitals and home health agencies that sharply crimped their profitability. In late 1999, Congress passed legislation to ameliorate some of BBA97's harshest fiscal consequences. As expected, profitability again started to increase. Nevertheless, the most recent decline in profitability started in 2006, long before the most recent recession started.
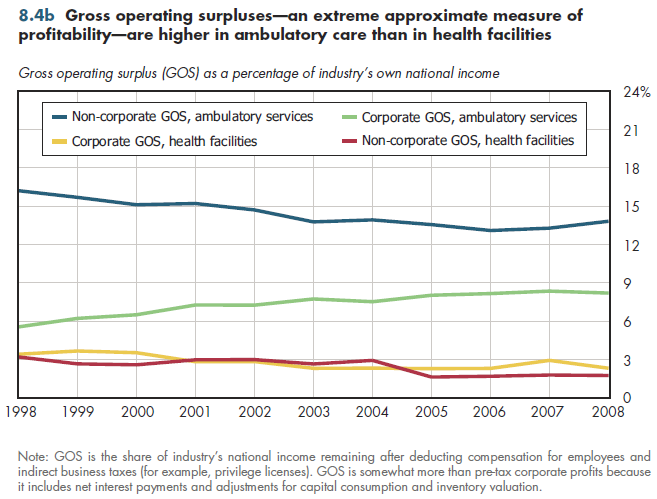
Although parallel profitability numbers are lacking at a more fine-grained level, approximate measures such as gross operating surpluses suggest that profits are high- er in the ambulatory health sector than in health facilities (figure 8.4b). In ambulatory care, corporate profits appear to be increasing in importance.

Download Excel workbooks used to create
Figure 8.4a Table and
Figure 8.4b Table.
[Note that you’d have separate links for each set of tables] Figures 8.4a and 8.4b were created from the following tables (the workbook includes all supporting tables used to create these tables):
- Fig. 8.4a: Table 8.4.1. Corporate Profits Before and After Taxes as Percentages of National Income Related to Health Care, 1963-2008
- Fig. 8.4b: Table 8.4.2. Gross Operating Surplus as a Percentage of National Income for Ambulatory Health Services and Hospitals and Nursing Facilities, 1998-2008
Download PowerPoint versions of both figures.
- Department of Commerce. Bureau of Economic Analysis.


