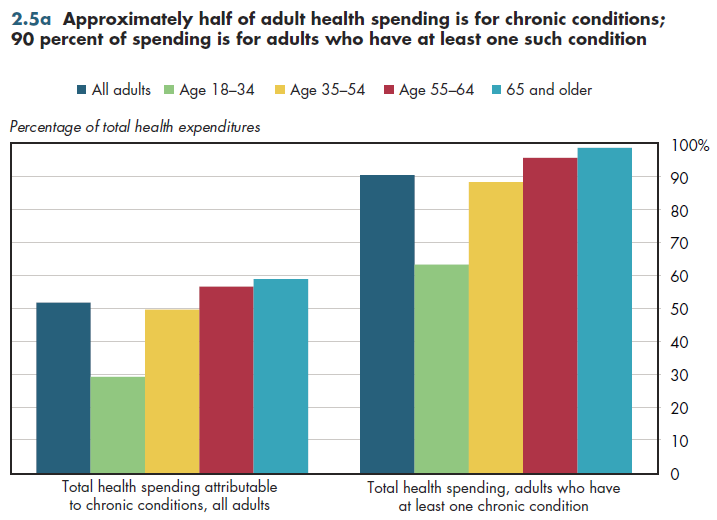
Just over half of adult health spending pays for chronic conditions. However, this average masks a lot of variation across age groups. For adults younger than age 35, just less than 30 percent of spending is specifically attributable to treating chronic conditions. In contrast, among the elderly, the share of PHCE having to do with chronic conditions is approximately double this level (figure 2.5a).

Approximately 60 percent of civilian adults not living in institutions have at least one chronic condition. Again, this ranges from a low of 36 percent of young adults to approximately 92 percent of the elderly. Consequently, those with at least one chronic condition account for more than 60 percent of total PHCE among young adults and 99 percent among the elderly.
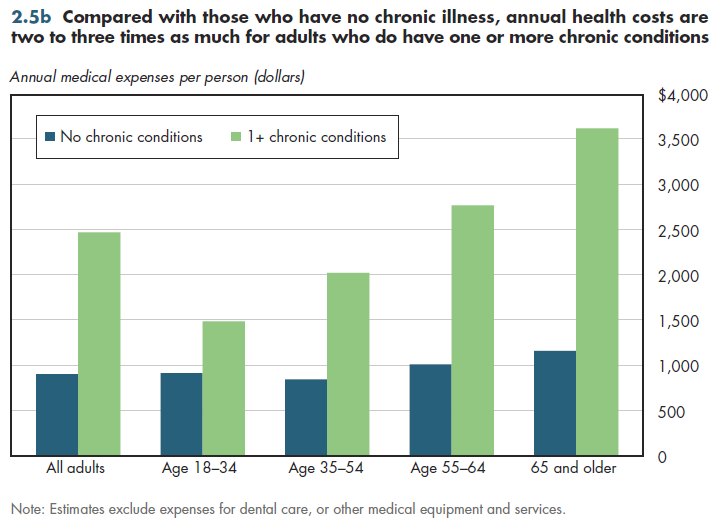
Chronic conditions are one reason that health expenditures increase so dramatically by age — something that will be examined in more detail (refer to figure 12.4a). Among adults having no chronic conditions, annual health expenses in 2005 averaged less than $1,000 per person, with elderly individuals experiencing only slightly higher spending than their adult counterparts in the lowest age category.
Average spending for those who had one or more chronic conditions was approximately 2.5 times as high as for those who had no such conditions—ranging from approximately 1.5 for young adults to almost 3.5 for the elderly (figure 2.5b). This rising differential with age reflects two mutually reinforcing effects. First, average spending per person for a given number of conditions rises with age. Thus, among adults with just one chronic condition, per capita spending for elderly adults is more than triple the annual spending incurred by their counterparts in the young adult age group. Some of this difference reflects the high cost of dying.

Second, the average number of chronic conditions per person also rises with age. The prevalence of two or more chronic conditions is more than five times as large for elderly adults compared with young adults (hence the reason for pre-existing conditions to matter so much in accurately pricing health insurance coverage). Set- ting prices based solely on age captures some of the variation that arises because of age-related differences in the rate and cost of chronic conditions. However, even within a fixed age group, the number and nature of chronic conditions results in large cost differences.
Download Excel tables used to create both figures:
Figures 2.5a/2.5b Tables.
Figures 2.5a and 2.5b both were created from the following table (the workbook includes all supporting tables used to create this table):
- Table 2.5. Adult Health Expenditures for Chronic Conditions, 2005
Download PowerPoint versions of both figures.
- Machlin S, JW Cohen and K Beauregard. Health Care Expenses for Adults with Chronic Conditions, 2005. Statistical Brief #203. May 2008. Agency for Health-care Research and Quality. Rockville MD. http://www.meps.ahrq.gov/mepsweb/data_files/publications/st203.pdf (accessed November 14, 2010).


