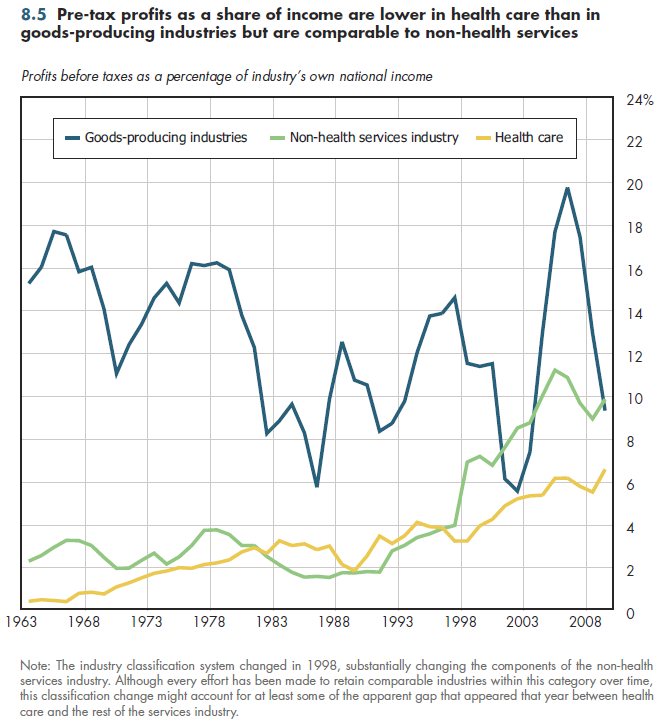
Before-tax corporate profits for health services are generally less than half the levels seen in private businesses as a group, even during times of recession. As illustrated in figure 8.5, in goods-producing industries (agriculture, forestry, fishing and hunting, mining, manufacturing, and construction), pre-tax profits typically are in the double-digit range, reaching as much as 20 percent in recent years. In contrast, pre-tax corporate profits in health services, while increasing, have consistently been much less than 10 percent of that industry's national income.

That said, profitability in the private economy, and major sectors such as goods and other services, are much more volatile than in the health services market. Consequently, there are brief periods during recoveries from recessions in which the share of national income going to profits in these other sectors increases more quickly than in health services. However, during the past 50 years, the secular rise in health sector profits as a share of health-related national income has been more rapid than in any other sectors.
The apparent sharp rise in profitability among all other services in 1998 might be a statistical anomaly. The BEA introduced a substantial revision in how industries were categorized, and they ceased reporting an aggregate number for "Services." Thus, since 1998, the total for services had to be derived by adding component parts. However, certain services (for example, information services) now appear in other BEA-reported aggregates. Conversely, some services appearing in the component parts might previously have been included in a different industry. Thus, the trend between 1998-2008 is more likely to be accurate than is the size of the large estimated increase between 1997 and 1998.
To avoid confusion, corporate profits shown here reflect the definitions used by the BEA. The BEA makes several adjustments (for example, inflation adjustments) to what are known as "book profits" that corporations report to stockholders in various financial reports. For most purposes, the adjusted BEA numbers are technically superior to these book amounts, but the adjustments also are arbitrary to some extent.
Download Excel tables used to create figure:
Figure 8.5 Table.
Figure 8.5 was created from the following table (the workbook includes all supporting tables used to create this table):
- Table 8.5. Corporate Profits Before Taxes as Percentages of Sector-Specific National Income, 1963-2008
Download PowerPoint versions of both figures.
- Department of Commerce. Bureau of Economic Analysis.


