Download PowerPoint versions of both figures.
Inside Collection (Book): American Health Economy Illustrated
12.6 Regional Differences in Health Spending per Capita Have Narrowed then Widened
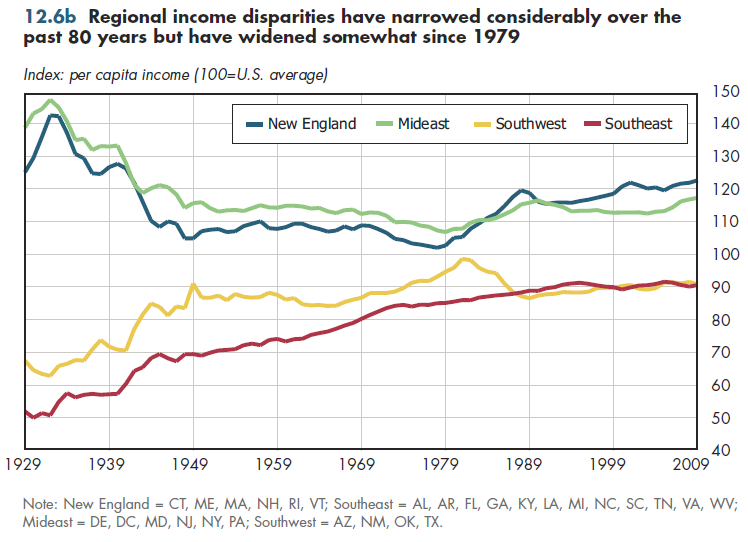
Summary: Regional differences in both health spending per capita and income per capita have widened somewhat since 1980. Before that time, per capita income differences had been narrowing for at least 50 years.
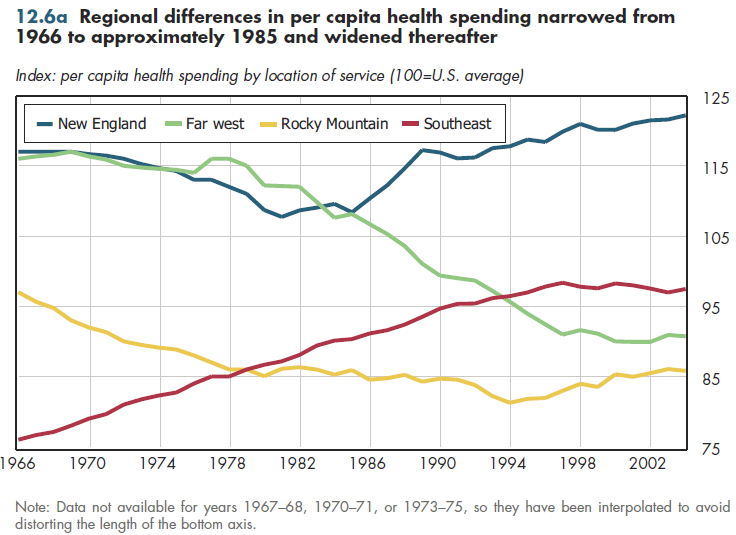
There is approximately a 40 percent difference between the regions having the highest and lowest health expenditures per capita (figure 12.6a). New England's per capita spending is more than 20 percent higher than the national average, and spending in the Rocky Mountain states is approximately 15 percent less than the U.S. average. This overall difference is approximately the same today as it was in the year Medicare and Medicaid started.

What has changed, however, are the relative ranks of some of the regions. The most dramatic change occurred in the Far West region, which in 1966 had the second highest level of per capita health spending, barely behind that of New England. In the decades that followed, the region's spending fell from 15 percent above the national average to approximately 10 percent below the average by 2004 (the latest year these data are available). The Rocky Mountain region also improved its relative position by approximately 10 percentage points.
In contrast, the Southeast climbed from having expenditures 25 percent below the nation's to an amount that by 2004 was only 5 percent lower. New England reduced its relative spending from 1966 to the early 1980s but thereafter gained approximately 15 percentage points relative to the U.S. average.
No single explanation for these trends exists. The Far West result was driven largely by California, which in the 20 years before 2004, arguably had the most competitive health care system in the country. New England is notable for generally having taken a more regulatory approach to health cost containment (refer to figure 14.3). These contrasting approaches to health regulation surely are not the only explanation for these large changes. However, the differences in approaches were so stark that it seems unlikely that they contributed nothing to New England's now having a level of health spending that is 35 percent higher than that of the Far West.
During at least half of the twentieth century, per capita incomes across regions had been converging until the mid-1970s, after which they grew somewhat (figure 12.6b). As an approximation, health spending per capita has mirrored this trend.

Downloads
References
- Author's calculations.
- Department of Commerce. Bureau of Economic Analysis.
- Department of Health and Human Services. Centers for Medicare and Medicaid Services.
Collection Navigation
- « Previous module in collection 12.5 Difference between Men and Women's Health Costs Depends on Age
- Collection home: American Health Economy Illustrated
- Next module in collection » 12.7 Regional Differences in Health Spending Burden Have Narrowed then Increased
Content actions
Give feedback:
Download:
Add:
Reuse / Edit:
Twin Cities Campus:
- © 2012 Regents of the University of Minnesota. All rights reserved.
- The University of Minnesota is an equal opportunity educator and employer. Privacy
- Last modified on Sep 26, 2013 1:52 pm -0500


