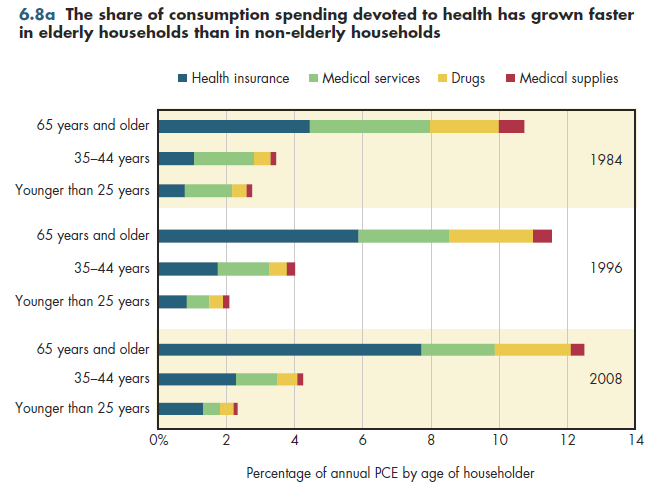
Despite the near-universal coverage of the elderly through Medicare, households headed by those 65 and older devote a considerably higher fraction of household spending for health care compared with households headed by younger adults. Moreover, over the past 25 years, the health care share has grown faster in elderly households compared with non-elderly households (figure 6.8a).

The relative difference in shares would be much smaller if the hidden costs of health coverage were taken into account. The amounts shown for health insurance include only the employee share of premiums. Because the average employer contributes approximately 80 percent of premiums for coverage provided through work, the amounts shown for health insurance premiums would have to be almost quadrupled were this cost made visible.
The large increase in the health insurance premium share of family spending for elderly households between 1996 and 2008 reflects the introduction of Medicare Part D drug coverage. Except for low-income households eligible for subsidies, Part D requires the payment of a premium covering approximately 25 percent of the costs covered by the benefit. It is interesting to note that little of this increase in premiums was offset by a corresponding decline in the share of household spending for out-of-pocket pharmaceutical payments.
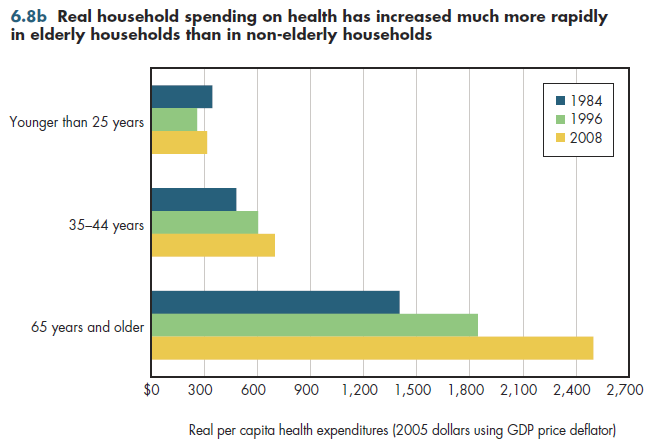
Real health spending also has increased far more rapidly for elderly households than for non-elderly households, increasing by more than $1,000 in the past 25 years (figure 6.8b). Remember that this includes only direct spending by households and excludes the significant share of spending financed by taxes.

Among non-elderly households, the health spending share has grown slowly but steadily over 25 years in households headed by 35-44 year olds, whereas the health spending share of household consumption spending for households headed by those younger than age 25 is currently somewhat less than it was 25 years earlier.
Download Excel tables used to create both figures:
Figures 6.8a/6.8b Tables.
Figures 6.8a and 6.8b both were created from the following table (the workbook includes all supporting tables used to create this table):
- Table 6.8. Health Care Spending as a Share of Average Annual Personal Consumption Expenditures, By Householder Age, 1984, 1996, and 2008
Download PowerPoint versions of both figures.
- Author's calculations.
- Department of Labor. Bureau of Labor Statistics.


