Download PowerPoint versions of both figures.
Inside Collection (Book): American Health Economy Illustrated
12.1 1% of Population Accounts for 25% of Health Spending
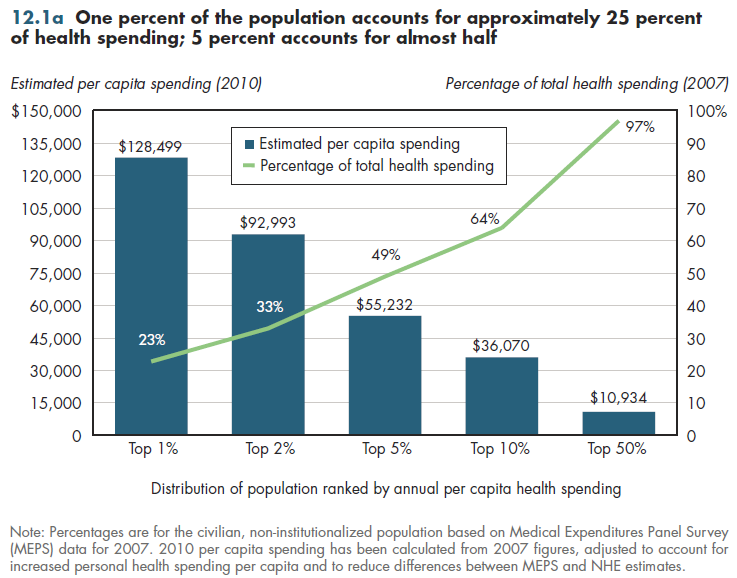
Summary: 1 percent of the population accounts for approximately 25 percent of health spending; 5 percent accounts for almost half.
The 1 percent of the population that has the highest annual health expenses accounts for almost 25 percent of health spending (figure 12.1a). Their annual spending in 2010 likely exceeded $125,000. Those in the top 5 percent account for just less than half of all spending, with average annual expenditures that exceed $50,000. With the average U.S. worker earning less than $50,000 a year, these numbers demonstrate the desirability of some kind of health insurance coverage. Few but the wealthiest families are in a position to self-insure spending at these amounts.

At the other end of the distribution, individuals in the bottom half of spenders account for only 3 percent of annual health costs. Their average annual spending is less than $350. Leaving aside administrative costs, an actuarially fair premium to cover only the catastrophic expenses of the top one percent would be almost $1300 a year. To cover the risk of being in the top 5 percent would require annual premiums of approximately $2,800. The challenge in a voluntary health insurance system is to convince a sizable share of those who have expected expenses of less than $350 to spend almost $3,000 to secure protection against risks that have only a 5 percent chance of occurring. The more low-risk individuals who opt out, the higher will be the premiums needed for those who remain. This greatly exaggerates the challenge when people are separated into different age groups. In that case, the difference between the lowest and highest spenders shrinks considerably.
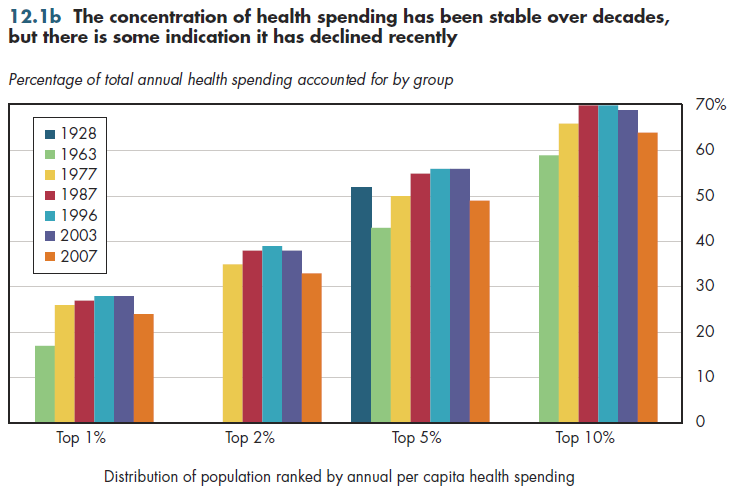
Only selected snapshots in time are available The concentration of health spending might have become somewhat larger between 1963 and 1996 (figure 12.1b). However, there is evidence that it has fallen slightly in subsequent years. All the data from 1996 through 2007 come from the same household survey. Thus, one cannot dismiss the changes observed prior to that as an artifact of differences in methods of collecting this kind of statistics. Only one data point (from 1928) shows that the top 5 percent of spenders accounted for just over half of spending. This situation is almost identical to the share of spending accounted for by the same group 40 years later. In light of the enormous changes in technology that occurred in the intervening decades, there is no reason to expect such stability in the degree of health expenditure concentration.

Downloads
References
- Author's calculations.
- Berk ML and AC Monheit. The Concentration of Health Care Expenditures, Revisited. Health Affairs 2001; 20(2):9-18.
- Cohen SB and W Yu. The Concentration and Persistence in the Level of Health Expenditures over Time: Estimates for the U.S. Population, 2006-2007. Agency for Healthcare Research and Quality. Rockville MD. March 2010.
- Department of Health and Human Services. Agency for Healthcare Research and Quality.
- Zuvekas SH and JW Cohen. Prescription Drugs and the Changing Concentration of Health Care Expenditures. Health Affairs 2007; 26(1):249-57.
Collection Navigation
- « Previous module in collection 11.5 Rise in US Rates of Return for Medical Education
- Collection home: American Health Economy Illustrated
- Next module in collection » 12.2 The Lowest-Income Families Have 2.5 Times Burden of Paying for Health Care Than That of the Highest-Income Families
Content actions
Give feedback:
Download:
Add:
Reuse / Edit:
Twin Cities Campus:
- © 2012 Regents of the University of Minnesota. All rights reserved.
- The University of Minnesota is an equal opportunity educator and employer. Privacy
- Last modified on Sep 26, 2013 1:42 pm -0500


