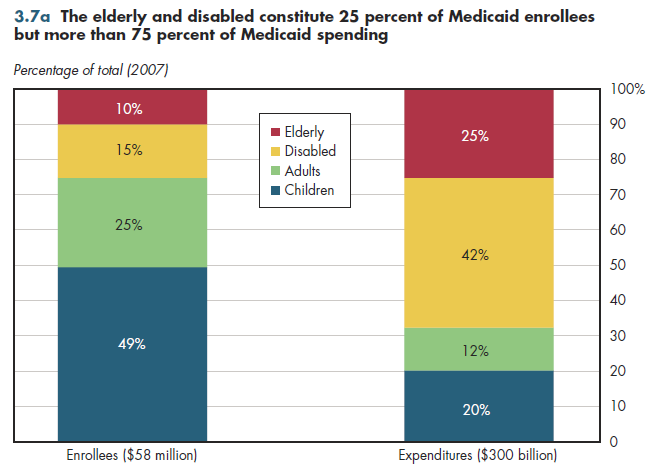
The average Medicaid beneficiary is much younger than those who are covered by Medicare. Children account for almost half of Medicaid enrollees, with non-elderly, non-disabled adults (predominantly young parents) accounting for an additional 25 percent (figure 3.7a).

Although the elderly and disabled make up approximately 25 percent of beneficiaries, they account for more than 75 percent of all expenditures for medical services. In contrast with Medicare, which was designed to be an acute-care insurance program, Medicaid spending is far more heavily tilted toward long-term care, particularly nursing home care. Approximately 30 percent of Medicaid spending is for long-term care services.
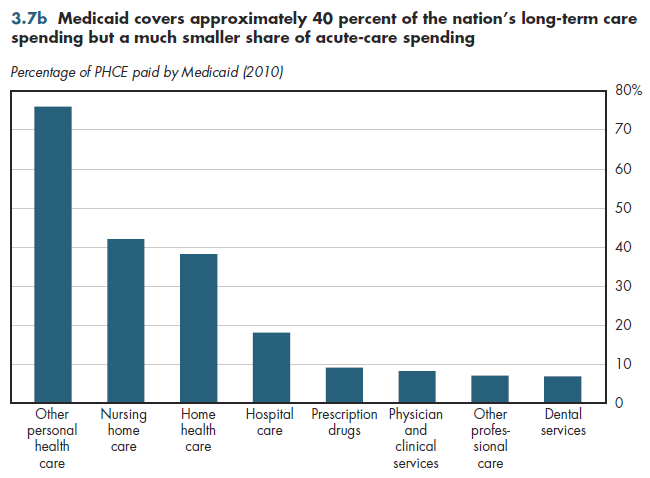
Medicaid accounts for more than 40 percent of all nursing home spending in the United States, and almost 40 percent of home health services (figure 3.7b). Other personal health care includes spending for Medicaid home- and community-based waivers, care provided in residential care facilities, ambulance services, school health, and worksite health care, so it too predominantly consists of long-term care services.

Medicaid enrollees account for fewer than 20 percent of the population, which is similar to the share of hospital spending financed by Medicaid. However, Medicaid covers fewer than 10 percent of all spending on care provided by physicians, dentists, and other health professionals, and prescription drugs.
This largely is a reflection of low Medicaid fees. For example, on average, physician fees under Medicaid are 28 percent lower than Medicare fees, but this varies enormously by state. Some states have physician fees that are 63 percent below Medicare on average, whereas in other states, average Medicaid fees exceed Medicare's by more than 40 percent. In addition, by federal law, state Medicaid programs are given a sizable discount on prescription drug prices in the form of mandatory rebates that must be paid to states by pharmaceutical manufacturers.
Under health reform, this is supposed to change. The new law requires states to raise Medicaid provider payment rates to Medicare levels in 2013 and 2014 for primary care services of pediatricians, internists and general and family practitioners. States subsequently can roll back these fee increases, but this might be politically difficult. Medicare fees for primary care also will be increased 10 percent between 2011 and 2015.
Download Excel tables used to create figure:
Figure 3.7b Table.
Figure 3.7b was created from the following table (the workbook includes all supporting tables used to create this table):
- Fig. 3.7b: Table 3.7. Medicaid Share of National Health Expenditures, by Component, 1960-2011
There’s no table for Fig. 3.7a since source is included directly on the slide.
Download PowerPoint versions of both figures.
- Kaiser Commission on Medicaid and the Uninsured. Medicaid: A Primer. Key Information on Our Nation's Health Coverage Program for Low-Income People. June 2010. http://www.kff.org/medicaid/upload/7334-04.pdf (accessed October 13, 2010).
- Department of Health and Human Services. Centers for Medicare and Medicaid Services.


