Skip to content Skip to navigation Skip to collection information

You are here: Home » Content » American Health Economy Illustrated » 9.6 Increase in Health Spending Explained 80% of Decline in Personal Savings

Navigation

Table of Contents

Recently Viewed

This feature requires Javascript to be enabled.
Download
×

Download collection as:

  • EPUB (what's this?)

    What is an EPUB file?

    EPUB is an electronic book format that can be read on a variety of mobile devices.

    Downloading to a reading device

    For detailed instructions on how to download this content's EPUB to your specific device, click the "(what's this?)" link.

  • More downloads ...

Download module as:

  • PDF
  • EPUB (what's this?)

    What is an EPUB file?

    EPUB is an electronic book format that can be read on a variety of mobile devices.

    Downloading to a reading device

    For detailed instructions on how to download this content's EPUB to your specific device, click the "(what's this?)" link.

  • More downloads ...
Reuse / Edit
×

Collection:

Module:

Add to a lens
×

Add collection to:

Add module to:

Add to Favorites
×

Add collection to:

Add module to:


9.6 Increase in Health Spending Explained 80% of Decline in Personal Savings

Module by: Christopher Conover. E-mail the author

Summary: Since 1982, increased personal health spending alone can explain approximately 80 percent of the decline in personal savings. Although U.S. health spending matches its gross annual savings, most of the nation's major competitors save much more than they spend on health care.

For at least 25 years, rising health expenditures generally have been matched by a parallel decline in the personal savings rate (figure 9.6a). Capital stocks are the accumulation of investment flows, the financing of which depends on savings. Total savings for the nation encompass private savings, government savings, and foreign investment.
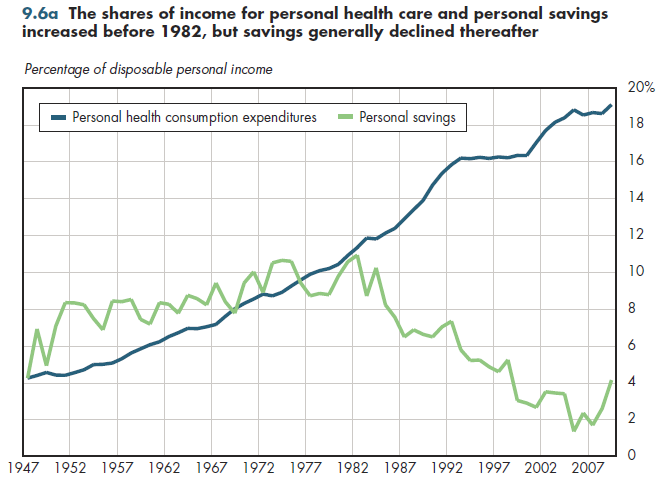
The shares of income for personal health care and personal savings increased before 1982, but savings generally declined thereafter.

Measured relative to disposable (post-tax) personal income, the personal savings rate generally was on an upward path for 35 years starting in 1947 (figure 9.6a). Taken together, Americans typically saved more than they spent on personal health care during this period. After 1982, there was a sharp reversal in this trend. The savings rate generally declined even as personal health spending continued to rise. Mathematically, the positive slope of the personal health spending line is almost as steep as the negative slope of the personal savings line. Statistically, approximately 80 percent of the variation in the personal savings rate can be explained simply by knowing the share of disposable income allocated to personal health spending.

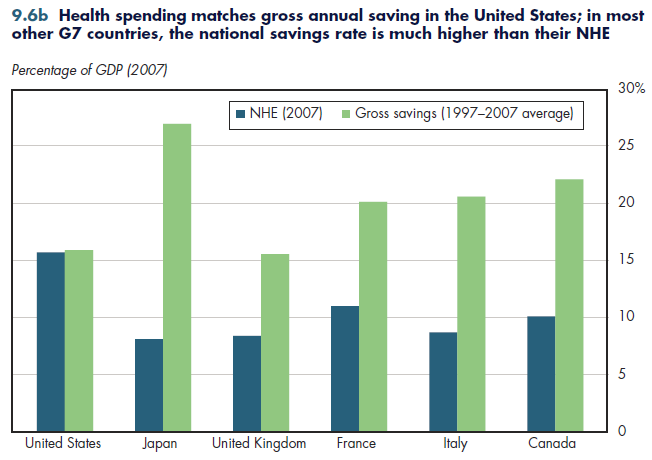
On average, gross annual saving in the United States is almost identical to its level of national health expenditures. In contrast, the savings rate among the rest of its G7 competitors generally is much more than their spending on health care (figure 9.6b).
.

The relationship between savings and health spending is not nearly as tight at the cross-national level as it is within the United States over time. Although the nation that has the lowest share of GDP devoted to health spending also has the highest savings rate (Japan), the nation that has the next-lowest health spending also has a savings rate almost identical to that of the United States (the UK). In terms of comparable purchasing power, U.S. GDP per capita is much higher than among its biggest competitors. To match U.S. savings in real per capita terms would unavoidably require these nations to devote a higher share of GDP to savings.

Downloads

Download PowerPoint versions of both figures.

Download Excel workbooks used to create Figure 9.6a Table and Figure 9.6b Table. [Note that you’d have separate links for each set of tables] Figures 9.6a and 9.6b were created from the following tables (the workbook includes all supporting tables used to create these tables):

  • Fig. 9.6a: Table 9.6.1. Personal Saving and Personal Health Care Expenditures as a Percentage of Disposable Personal Income, 1947-2009
  • Fig. 9.6b: Table 9.6.2. Gross National Saving and National Health Expenditures as a Percentage of GDP, Selected Countries, 2007

References

  1. Author's calculations.
  2. Department of Commerce. Bureau of Economic Analysis.
  3. Organisation for Economic Co-operation and Development.

Collection Navigation

Content actions

Download:

Collection as:

EPUB (?)

What is an EPUB file?

EPUB is an electronic book format that can be read on a variety of mobile devices.

Downloading to a reading device

For detailed instructions on how to download this content's EPUB to your specific device, click the "(?)" link.

| More downloads ...

Module as:

PDF | EPUB (?)

What is an EPUB file?

EPUB is an electronic book format that can be read on a variety of mobile devices.

Downloading to a reading device

For detailed instructions on how to download this content's EPUB to your specific device, click the "(?)" link.

| More downloads ...

Add:

Collection to:

My Favorites (?)

'My Favorites' is a special kind of lens which you can use to bookmark modules and collections. 'My Favorites' can only be seen by you, and collections saved in 'My Favorites' can remember the last module you were on. You need an account to use 'My Favorites'.

| A lens I own (?)

Definition of a lens

Lenses

A lens is a custom view of the content in the repository. You can think of it as a fancy kind of list that will let you see content through the eyes of organizations and people you trust.

What is in a lens?

Lens makers point to materials (modules and collections), creating a guide that includes their own comments and descriptive tags about the content.

Who can create a lens?

Any individual member, a community, or a respected organization.

What are tags? tag icon

Tags are descriptors added by lens makers to help label content, attaching a vocabulary that is meaningful in the context of the lens.

Module to:

My Favorites (?)

'My Favorites' is a special kind of lens which you can use to bookmark modules and collections. 'My Favorites' can only be seen by you, and collections saved in 'My Favorites' can remember the last module you were on. You need an account to use 'My Favorites'.

| A lens I own (?)

Definition of a lens

Lenses

A lens is a custom view of the content in the repository. You can think of it as a fancy kind of list that will let you see content through the eyes of organizations and people you trust.

What is in a lens?

Lens makers point to materials (modules and collections), creating a guide that includes their own comments and descriptive tags about the content.

Who can create a lens?

Any individual member, a community, or a respected organization.

What are tags? tag icon

Tags are descriptors added by lens makers to help label content, attaching a vocabulary that is meaningful in the context of the lens.

Reuse / Edit:

Reuse or edit collection (?)

Check out and edit

If you have permission to edit this content, using the "Reuse / Edit" action will allow you to check the content out into your Personal Workspace or a shared Workgroup and then make your edits.

Derive a copy

If you don't have permission to edit the content, you can still use "Reuse / Edit" to adapt the content by creating a derived copy of it and then editing and publishing the copy.

| Reuse or edit module (?)

Check out and edit

If you have permission to edit this content, using the "Reuse / Edit" action will allow you to check the content out into your Personal Workspace or a shared Workgroup and then make your edits.

Derive a copy

If you don't have permission to edit the content, you can still use "Reuse / Edit" to adapt the content by creating a derived copy of it and then editing and publishing the copy.

  • © 2012 Regents of the University of Minnesota. All rights reserved.
  • The University of Minnesota is an equal opportunity educator and employer. Privacy
  • Last modified on Oct 29, 2013 5:13 am -0500