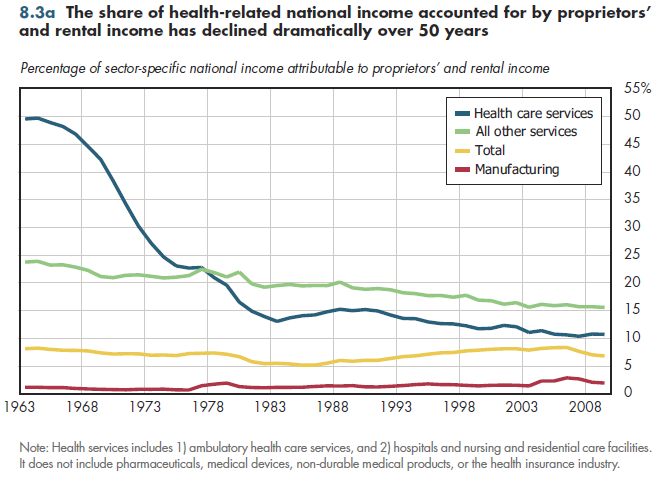
Before Medicare and Medicaid, approximately half of national income for health services went to proprietors' and rental income. Not even 20 years later, this amount was less than 15 percent. It has steadily declined further to approximately 10 per- cent today (figure 8.3a). During this period, the rest of the services sector also saw a declining share of its national income going to proprietors' and rental income, but this occurred much less rapidly than in health services.

The current level in health care (just over 10 percent) is below the share seen in the rest of the services sector and is only slightly more than the percentage in the economy overall. In contrast, the share is less than 3 percent in manufacturing.
A growing number of physicians have abandoned their own practices in favor of a buy-out by hospitals or managed care plans. There now are thousands of retail clinics run by major chains such as CVS, Walgreen's, and Wal-Mart. With health reform, pressures to adopt electronic medical records are likely to fuel a continuation of this trend away from solo practices and partnerships into corporate medicine.
In principle, owner income reflects both what unincorporated health professionals earn as labor (wages, salaries, fringe benefits) and some hard-to-measure remainder (if anything) that represents profits. If a solo practitioner with a net income of $200,000 became a hospital employee whose total compensation was $200,000, total spending would remain unchanged. However, the employee compensation share of national income would rise by the identical amount that proprietors' income fell.
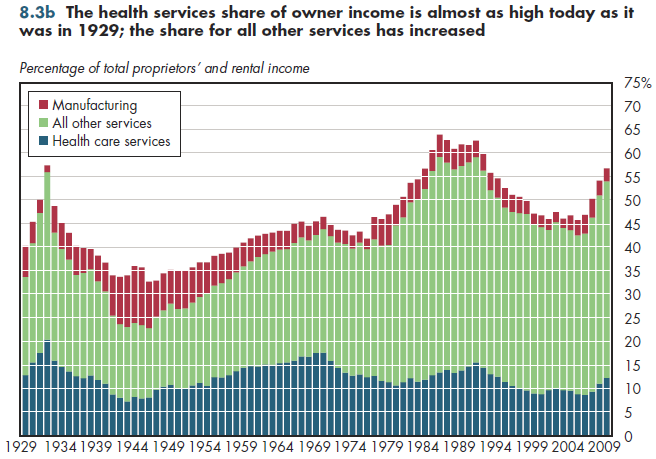
Another way to look at these trends is to consider what share of total proprietors' and rental income is accounted for by the health sector. Today, health services account for approximately one in eight dollars of such income (figure 8.3b), contributing more than $100 billion to the national total. In absolute dollar terms, this is the highest it has ever been. One-eighth also is the highest share since 1994 and is almost identical to the share observed in 1929. Even so, over 80 years, the health sector share has never exceeded 20 percent except in 1932.

Download Excel tables used to create both figures:
Figures 8.3a/8.3b Tables.
Figures 8.3a and 8.3b both were created from the following table (the workbook includes all supporting tables used to create this table):
- Table 8.3. Proprietors' and Rental Income as a Percentage of National Income for Selected Industries, 1929-2009
Download PowerPoint versions of both figures.
- Department of Commerce. Bureau of Economic Analysis.


