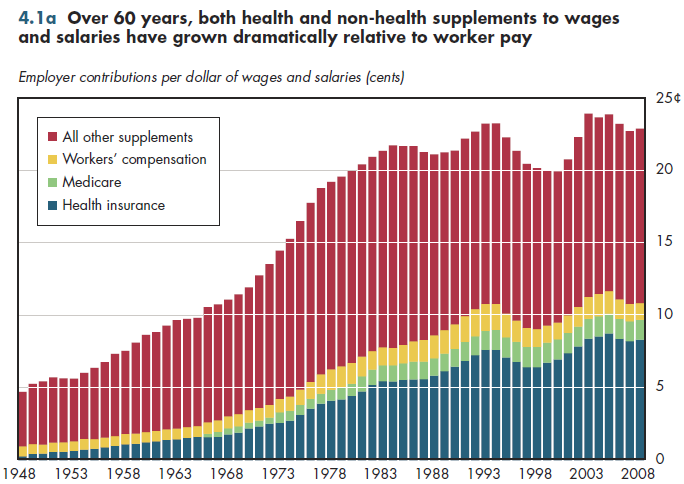
Over the past 60 years, the amount of employee compensation for wage and salary supplements has more than quadrupled (figure 4.1a). The average worker now receives approximately 23 cents in such employer-paid supplements for every dollar of wages and salaries. This growth has been variable, including brief periods in which wages and salaries grew faster than supplements. A relatively small amount of this increase relates to government-required health-related supplements—including payroll taxes for Medicare and workers' compensation (which pays for job-related injuries or illness).

The employer share of employer-sponsored insurance (ESI) has been an important factor in driving growth in supplement payments. Even so, increases in non- health fringe benefits such as retirement contributions also have had an important role in this upward trend. In both cases, tax policy has encouraged such growth because fringe benefits are excludable from federal, state, and local income taxes and payroll taxes. For the highest income workers who in some states face marginal tax rates of 50 percent, the tax exclusion permits employers to provide two dollars in pre-tax fringe benefits for every dollar that otherwise would be paid as wages or salaries.
ESI includes all types of plans, including fee-for-service indemnity plans, and managed care plans such as preferred provider organizations (PPOs) and health maintenance organizations (HMOs). Managed care plans use various cost control mechanisms (for example, pre-authorization of care and financial incentives for patients to use preferred provider networks). However, indemnity plans also have begun to use some of the same tools.
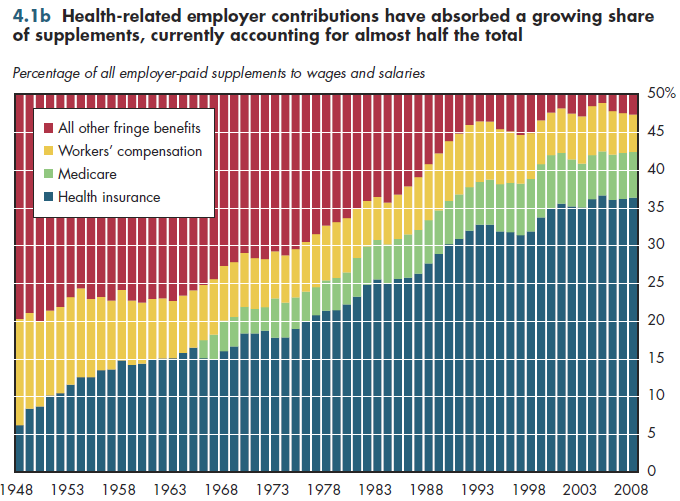
In general, over these 60 years, health-related supplements have grown as a fraction of all employer-provided supplements (figure 4.1b). This implies that health-related supplements have generally grown faster than other fringe benefits. For a typical worker, employer premium payments now constitute 36 percent of all fringe benefits, with Medicare and workers' compensation absorbing another 5 and 6 percent, respectively. All other fringe benefits have declined from almost 80 percent of the total just after World War II to slightly more than half today.

Download Excel tables used to create both figures:
Figures 4.1a/4.1b Tables.
Figures 4.1a and 4.1b both were created from the following table (the workbook includes all supporting tables used to create this table):
- Table 4.1. Employer Wages & Salaries, Contributions for Private Health Insurance, Medicare, Workers Compensation and Other Supplements to Wages and Salaries: 1948 to 2012
Download PowerPoint versions of both figures.
- Department of Commerce. Bureau of Economic Analysis.


