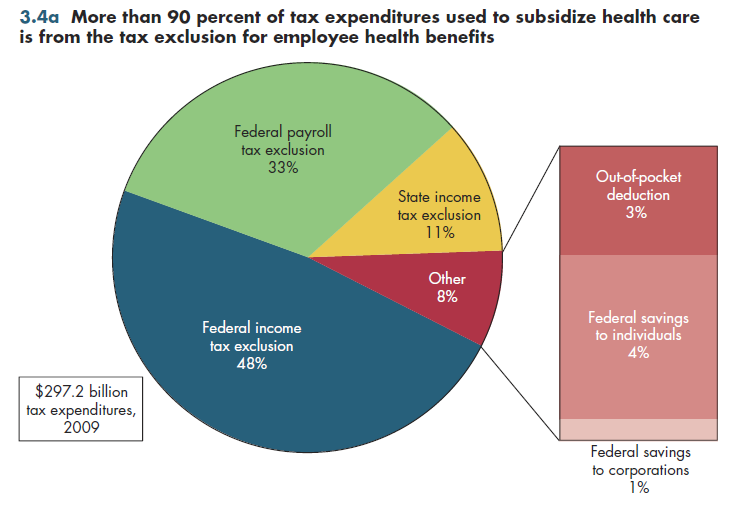
Tax subsidies having to do with health care now amount to approximately $300 billion a year. The federal share of this total is more than the federal government now pays for its share of Medicaid. Thus, ironically, the federal government in 2009 paid more to encourage employer-based health insurance than it spent on public health insurance for those who have low incomes, although this no longer will be true whether or not health reform is implemented.
Tax expenditures represent the lost tax revenue associated with giving more favorable treatment to particular actions or activities. Unlike Medicare and Medicaid, such subsidies do not show up as a line item in the federal budget either as expenditures or as deductions from expected revenue. For this reason, tax expenditures are far less visible to most Americans than are the direct expenditures financed by the national treasury.
Health-related tax expenditures take many forms, but more than 90 percent of costs attributable to them relate to the previously mentioned tax exclusion. This tax exclusion results in income tax losses at the federal and state levels, but also payroll taxes for Medicare and Social Security. By comparison, other tax expenditures (such as the Schedule B deduction for households that have large health expenses relative to income) are minuscule. The large expense threshold currently is 7.5 percent of adjusted gross income (AGI) but will increase to 10 percent in 2013 under the new health reform bill. Other miscellaneous health-related tax benefits received by individuals or corporations account for even smaller amounts of tax expenditures.
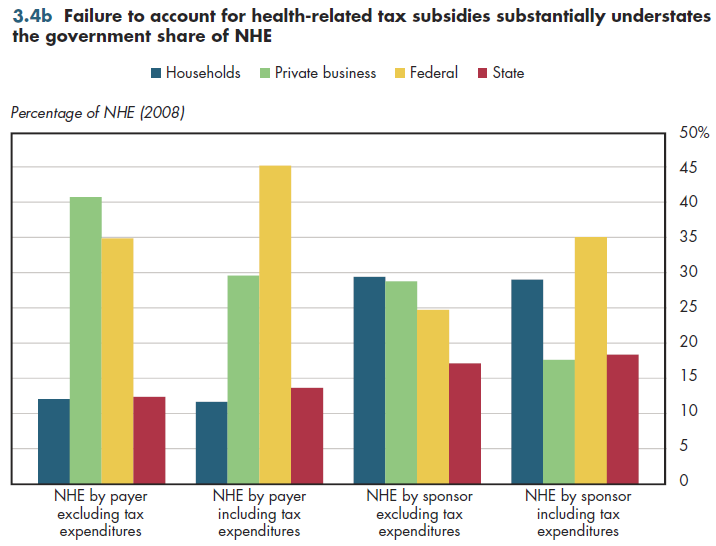
The magnitude of tax expenditures changes the picture of who is actually paying for health care. In the traditional payer view of financing, business accounts for more than 40 percent of spending, while the federal government accounts for just over 30 percent. With tax expenditures factored into NHE, the federal government by far becomes the largest payer, accounting for 45 percent of spending (figure 3.4b, left columns). All levels of government account for almost 60 percent of NHE compared with less than half this amount when tax expenditures are ignored. Even under the sponsor view of health spending described previously, government accounts for more than half of all health spending when tax expenditures are made visible.

One in seven dollars of personal health care spending now is paid for out-of-pocket compared with seven in eight dollars 80 years ago (figure 3.5a). This by far is the most significant change in health care financing over the past 80 years. Combining all other spending into a single amount, figure 3.5a illustrates quite clearly that the "wedge" of health insurance payments displaced both out-of-pocket and other health spending. This wedge has grown steadily larger each decade.
Download Excel tables used to create
Figures 3.4a/3.4b Tables.
Figures 3.4a and 3.4b were created from the following table (the workbook includes all supporting tables used to create this table):
- Fig. 3.4a: Table 3.4.1. Distribution of Tax Expenditures Related to Health Care, 2008-2011
- Fig. 3.4b: Table 3.4.2. Distribution of National Health Expenditures by Source of Revenue, 2009
Download PowerPoint versions of both figures.
- Author's calculations.
- Department of Health and Human Services. Centers for Medicare and Medicaid Services.
- Office of Management and Budget.
- Sheils J. The Tax Expenditure for Health: Update for 2007. The Lewin Group. April 29, 2008. http://www.newamerica.net/files/SheilsPPT.pdf (accessed November 13, 2010).


