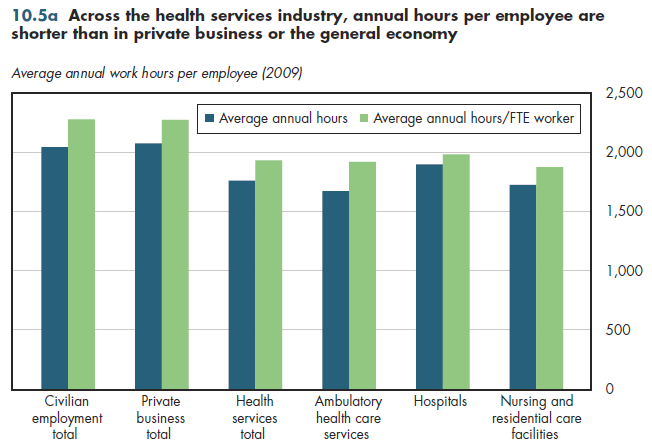
The average health care worker spends fewer hours a year working than do employees in private business or all civilian workers (the latter includes government employees). This statement is valid regardless of whether hours per worker or average annual hours per full-time equivalent (FTE) worker are counted (figure 10.5a). Within the health services industry, hospital workers have the longest work-years, followed by ambulatory health care services employees and those in nursing and residential care facilities. These respective differences are less than the difference in hours worked in health care compared with the total economy.

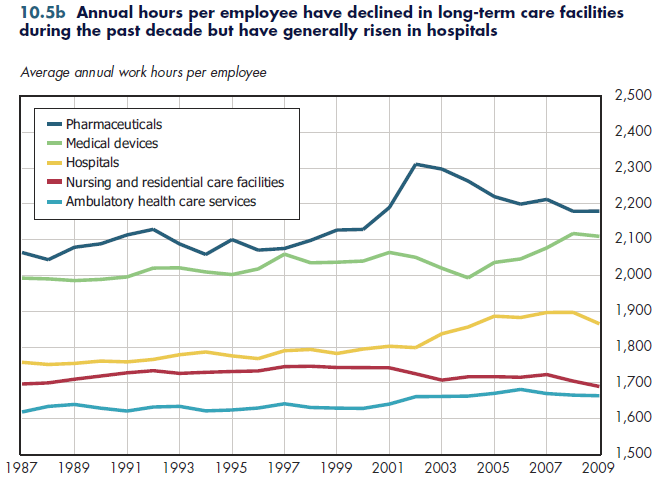
Annual hours worked in the goods-producing part of the health sector, including manufacture of pharmaceuticals and medical equipment, are much more than in the general economy. In pharmaceuticals, the length of the work-year peaked in 2002 but has declined subsequently, even though the total number of employees in the industry continues to grow (except for the years 2008 and 2009, which reflects the economic slow-down).
In the hospital industry, the work-year has generally increased since 1987, but hospital employees also saw a sharp increase in their annual hours starting in 2002 (figure 10.5b). This increase likewise occurred despite rising numbers of hospital employees. Changes in the length of the work-year have been more modest in ambulatory health care services, and nursing and residential care facilities. Since the start of the 21st century, there has been a general, modest decline in the length of the work- year among employees of nursing homes. In contrast, the length of the work-year generally has risen in the ambulatory care sector for approximately 20 years.

Download PowerPoint versions of both figures.
Download Excel tables used to create
Figures 10.5a/10.5b Tables.
Figures 10.5a and 10.5b were created from the following tables (the workbook includes all supporting tables used to create this table):
- Fig. 10.5a: Table 10.5.1. Average Annual Work Hours for Selected Components of the Health Sector, 2009
- Fig. 10.5b: Table 10.5.2. Annual Hours per Employee, by Industry, 1987–2009
- Author's calculations.
- Department of Labor. Bureau of Labor Statistics.


