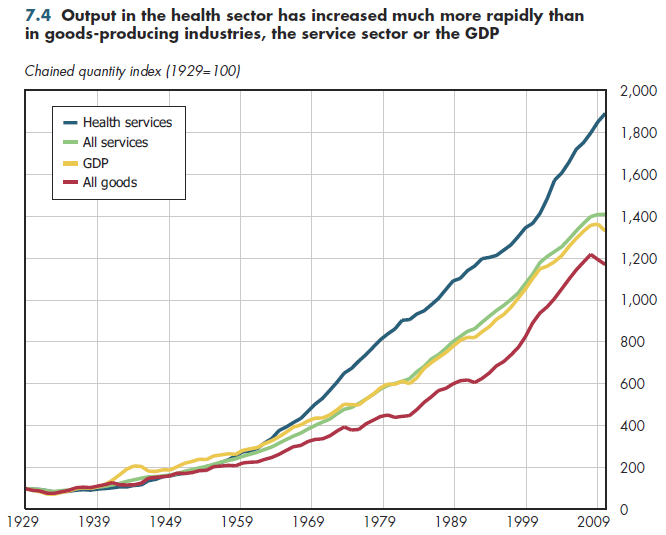
Overall output for health services has increased 19-fold since 1929. In contrast, GDP rose only 13-fold. The numbers shown in figure 7.4 remove the effects of inflation and are intended to measure the net increase in quantity of goods and services produced relative to the base year. As with the numbers for workers' compensation, these estimates exclude some important components of health sector output, including pharmaceuticals, medical devices, non-durable medical products, and output for government-run enterprises such as publicly owned hospitals.

Until the early 1960s, the rate of increase in health sector output did not diverge substantially from growth in economy-wide output (that is, GDP). The introduction of Medicare and Medicaid substantially expanded the number of individuals who have health insurance coverage, producing a surge in added demand for health services. With the exception of a brief period in the mid- to late-1990s, health services output almost invariably has grown faster than real GDP. In contrast, the real quantity of all services (inclusive of health services) rose almost in lockstep with GDP, while output in goods-producing industries lagged behind GDP growth. This might seem inconsistent with the previous data that America has increasingly become a service economy. The numbers shown in figure 7.4 isolate the quantity of output from the cost of providing it. It is possible to infer from the difference that prices in the service sector (including health) have increased much more rapidly than in the economy overall.
It is noteworthy that although GDP and output in goods-producing industries declined during the most recent recession (and real output in the service sector remained flat), health care output continued to rise. While past recessions have tended to slow the rate of growth in real health output, they rarely have resulted in an actual downturn. This is discussed further in chapter 16.
Even under the most ambitious versions of health reform, long-term trends in health spending are likely to absorb a growing share of GDP (chapter 20). Thus, the divergence in growth rates between health care and the rest of the economy is extremely likely to grow larger, certainly within the next decade or two.
Download Excel tables used to create figure:
Figure 7.4 Table.
Figure 7.4 was created from the following table (the workbook includes all supporting tables used to create this table):
- Table 7.4. Changes in Production of Health Care, Goods, Services, and GDP
Download PowerPoint versions of both figures.
- Department of Commerce. Bureau of Economic Analysis.


