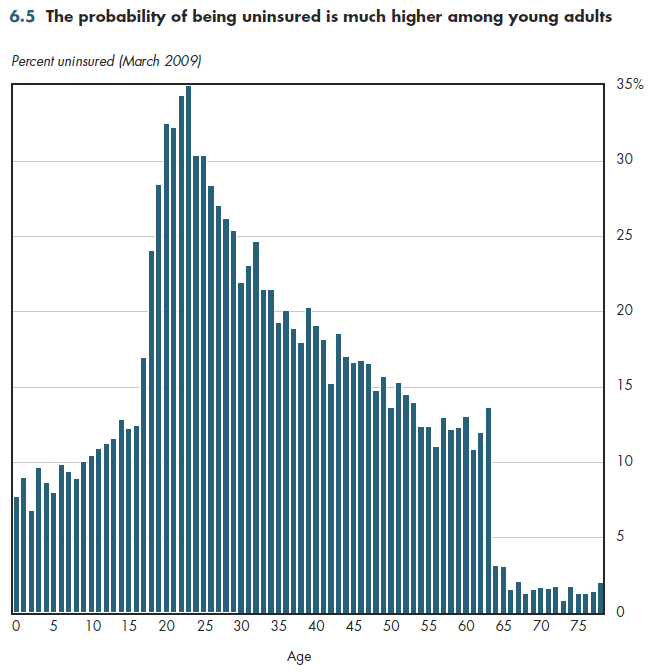
A more detailed view of the uninsured makes obvious that lack of coverage rises during teenage years and peaks in the early 20s. As indicated in figure 6.5, in subsequent years, the rate of being uninsured declines rather steadily until a sharp drop-off among those age 65 and older.

Over the past 25 years, a series of Medicaid expansions (starting in the mid-1980s) and SCHIP contributed to reducing the uninsured risk, especially among infants and children younger than age six. Young adults face a higher risk of being uninsured not only because many entry-level jobs do not offer coverage but also because they generally have lower incomes than established workers do, and their perceived need for coverage also is lower than that of older workers. Even though age-related premiums are legally permissible, employer coverage usually is community-rated, so the employee share of the premium is typically the same for all workers even though the youngest workers are less likely to use the plan. Thus, even when the employer pays 80 percent of the premium, such coverage is less of a deal for younger workers than for older workers. For all these reasons, young workers are less likely to be willing to pay the costs of offered coverage or to obtain non-group coverage when their employer elects not to offer a plan.
More generally, both the need for coverage and earnings typically increase with age, contributing to an increase in the demand for health coverage that levels off for those in their early 50s. Because a large number of retirees automatically qualify for Medicare coverage, the residual number without any coverage at all is quite small. Such uninsured elderly might not have a long enough earnings history to qualify for Medicare, or they might have been in a category of worker not covered by Medicare (for example, government workers were not required to be covered until the 1980s).
If health reform is fully implemented, the absolute number of uninsured will decline, but this age profile is likely to persist. Because the new health law moves the system further in the direction of community rating, many young people are likely to find it is less expensive to pay the penalty for not having coverage than to purchase it.
Download Excel tables used to create figure:
Figure 6.5 Table.
Figure 6.5 was created from the following table (the workbook includes all supporting tables used to create this table):
- Table 6.5. Distribution of Persons Who are Uninsured, By Age, 2009 and 2012
Download PowerPoint versions of both figures.
- Department of Commerce. Bureau of the Census.


