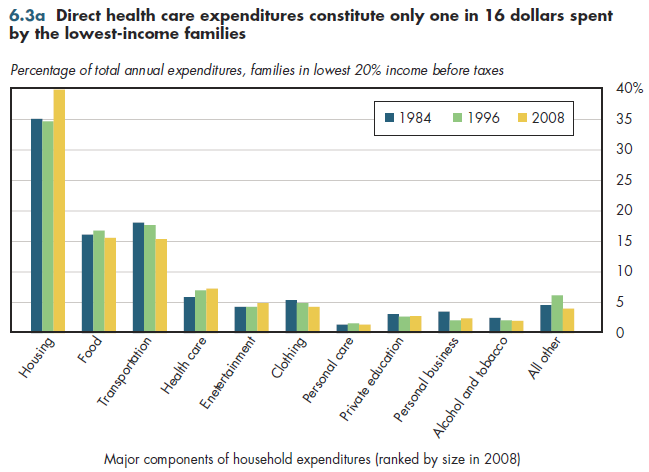
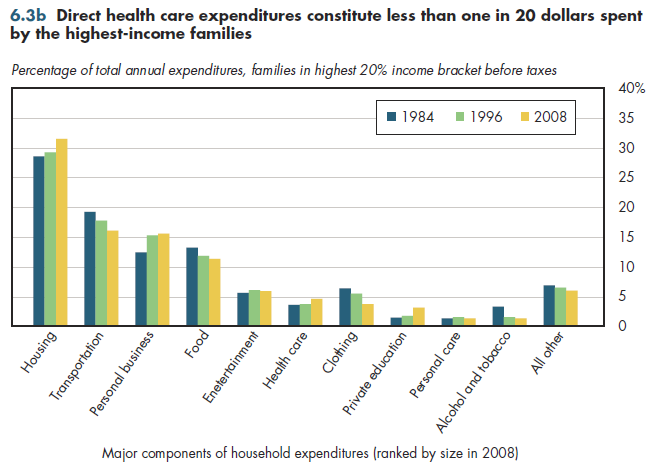
Direct purchases of health care comprise only one in 16 dollars of annual household spending in families in the bottom fifth of families ranked by income (figure 6.3a). How can health care comprise 20 percent of household consumption yet only five to seven cents per dollar of spending? The explanation is simple. A huge fraction of family health consumption is financed outside the family (or at least appears to be). For example, the numbers shown in figure 6.3a exclude all tax-financed health care financed by third parties. Although households ultimately pay for such care through their own taxes, the amount of tax-financed care for any given family will almost never match that family's implicit contribution in health-related taxes. Likewise, the numbers also exclude employer-paid premiums for health insurance even though such costs generally are borne by covered workers in the form of lower wages.

Viewed from this more limited perspective, the health-spending share of family budgets is only slightly higher among the lowest-income families compared with the highest-income families (figure 6.3b). This occurs because so much health care for those at the bottom of the income distribution is financed through taxes. The hidden costs of employer-provided coverage represent a much higher share of income for low-wage workers compared with those who have high salaries or wages. Visible and hidden premium expenses amounted to almost half of family income for those who had the lowest incomes (chapter 4).

Even though other components of spending also are subsidized (for example, food assistance, housing programs), the lowest-income families devote almost half of their spending to food, clothing, and shelter. Worth noting also is that in such families, the share of annual spending for alcohol, tobacco, and recreation is only slightly smaller than the health share.
The relative financial burden of health care rose approximately 25 percent between 1984 and 2008. Growth in this burden was slightly faster among the highest-income households relative to those in the lowest-income group. A different result emerges when the hidden costs of health care are allocated to the households that actually incur them.
Download Excel tables used to create both figures:
Figures 6.3a/6.3b Tables.
Figures 6.3a and 6.3b both were created from the following table (the workbook includes all supporting tables used to create this table):
- Table 6.3. Distribution of Average Annual Expenditures for Families in the Lowest and Highest Quintiles of Income Before Taxes, 1984, 1996, 2008
Download PowerPoint versions of both figures.
- Department of Labor. Bureau of Labor Statistics.


