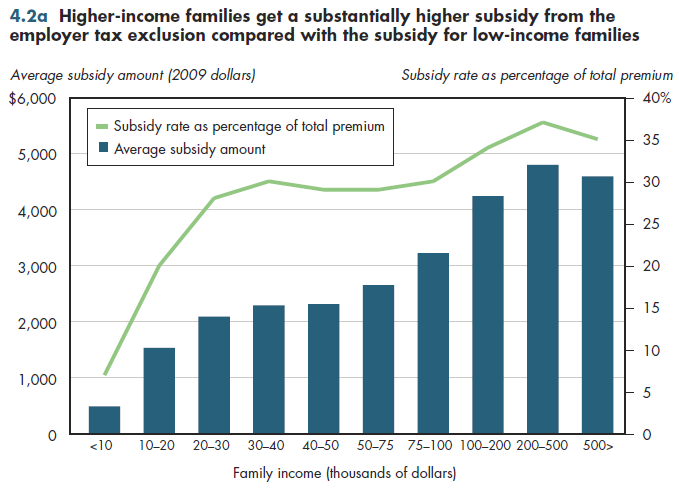
The employer tax exclusion for health benefits has been characterized as an upside-down subsidy. Our generally progressive tax system results in higher marginal tax rates for high-income workers compared with rates for low-income workers. Consequently, both the dollar value of the tax subsidy and the percentage of the premium that is implicitly subsidized by the federal government are larger for higher-paid workers compared with that for lower-paid workers (figure 4.2a).

For example, a company CEO earning $300,000 would receive a subsidy of approximately $4,800, which amounts to a discount of 37 percent on the premiums required for health insurance. A janitor earning the minimum wage in that same company would get a subsidy equal to less than $500—enough to cover only 7 percent of health plan premiums.
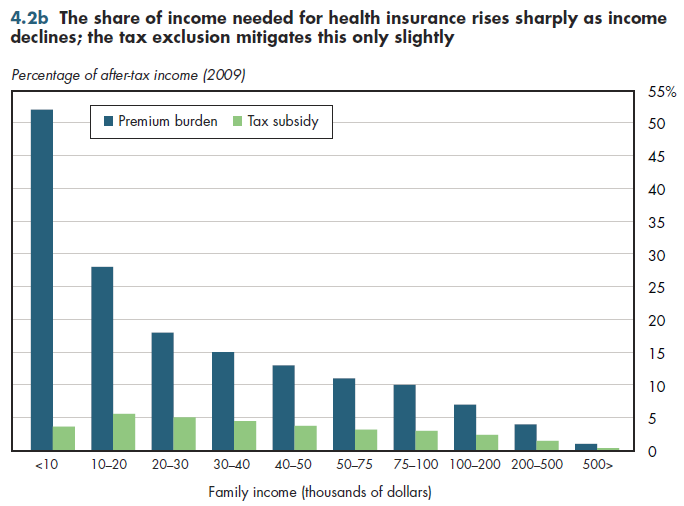
Even though the employer appears to be paying most or all of the premiums for employer-provided health benefits, empirical studies have demonstrated that the cost of such benefits actually is paid by workers in the form of lower wages or salaries. Thus, another way to view the subsidy is to consider it relative to the overall share of family income required to pay for health insurance coverage (inclusive of the employer share).
When calculated as a share of family income, the subsidy generally declines with income (figure 4.2b). This makes it appear less regressive. However, the share of family income required for health insurance rises sharply for workers at the lowest end of the income distribution. The tax subsidy does not grow nearly as fast. Thus, even with the tax subsidy, the net share of income (that is, after deducting the subsidy) required for health insurance declines with income.

Under the newly enacted health reform plan, the share of family income required to pay the family's share of premiums will be capped at 2 to 9.5 percent of income. However, these caps apply only to the family share of premiums, not to the employer- paid portion. Thus, for the most part, the hidden inequities just noted will persist for those who continue to rely on employer-based coverage.
Download Excel tables used to create both figures:
Figures 4.2a/4.2b Tables.
Figures 4.2a and 4.2b both were created from the following table (the workbook includes all supporting tables used to create this table):
- Table 4.2. Tax Subsidy for Employer-Sponsored Insurance (ESI), by Income Decile
Download PowerPoint versions of both figures.
- Burman L, S Khitatrakun and S Goodell. Tax Subsidies for Private Health Insurance: Who Benefits and at What Cost? Robert Wood Johnson Foundation. 2009 Update. Princeton. July 2009.


