A precise comparison across countries of total output (or consumption) having to do with health care is as difficult as a precise comparison of health care output across widely separated years in the same country. Even when accurately valuing the output of each country in its own currency, no precise, accurate way exists to convert these values into a common currency. In 2007, NHE per capita in Canada was $4,713 Canadian, whereas U.S. NHE per capita was $7,290. How many Canadian dollars equal a U.S. dollar in terms of the amount of health services they represent? Both the mixture of health services and relative health prices differ in the two countries; this fact negates any possibility of a certain answer.
The best, though imperfect, way to arrive at an answer involves three steps. The mathematics are too complicated to explain here. Conceptually, purchasing power parity (PPP) essentially represents how many Canadian dollars would match the U.S. dollar in terms of purchasing the identical "market basket" of goods.
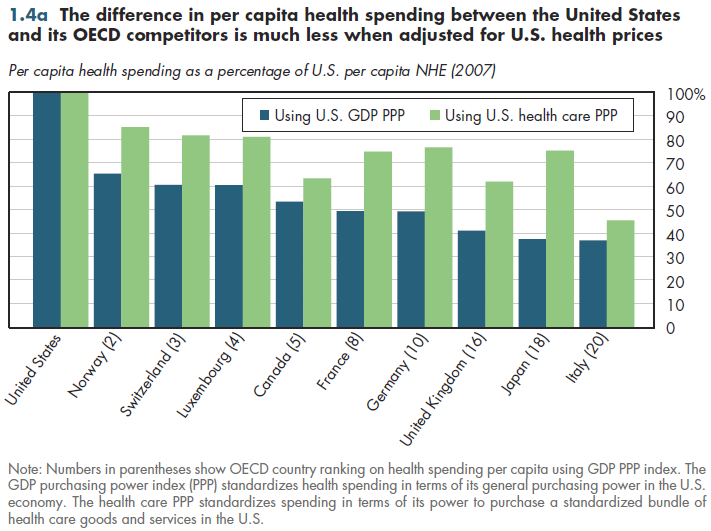
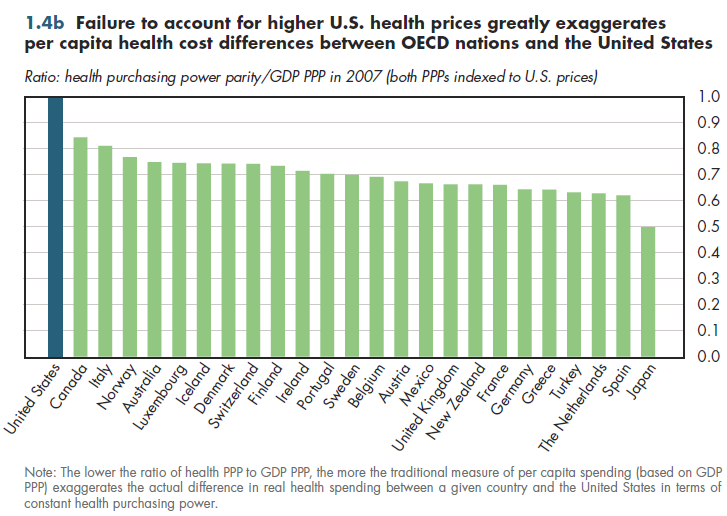
This computing method provides a PPP exchange rate for the entire economy (termed GDP PPP here) or for a single sector such as health care. Using GDP PPPs to adjust health spending provides a measure of how the opportunity cost of health spending varies across countries. As shown in figure 1.4a, to purchase its health care, the United States foregoes 50 percent more output in absolute terms than second- place Norway. However, because U.S. health prices are 25 percent higher than in the Organisation for Economic Co-operation and Development (OECD) — although its economy-wide prices are 5 percent lower — the GDP PPP exchange rate overstates the amount of health output a U.S. dollar could buy. The health PPP exchange rate provides a more accurate comparison of actual health resource use across countries: U.S. output of health resources is only 18 percent higher than in Norway, rather than the 50 percent previously stated.

Health PPP in U.S. dollars is lower than GDP PPP for all OECD members (figure 1.4b); thus, the widely reported cross-national health spending dollars (calculated using GDP PPP) greatly exaggerate the true differences in health resource use between the United States and other nations.

Download Excel tables used to create both figures:
Figures 1.4a/1.4b Tables.
Figures 1.4a and 1.4b both were created from the following table (the workbook includes all supporting tables used
to create this table):
- Table 1.4. Measures of Country Size and National Health Expenditures Per Capita, OECD Member Countries: 2007
Download PowerPoint versions of both figures.
- Author's calculations.
- Organisation for Economic Co-operation and Development.


