Even among publicly traded companies, industries having to do with health services tend to have lower rates of return than most other industries. Profitability for health services generally was less than in other major sectors of the economy (refer to figure 8.5). Some might view this as misleading because so much of the health industry is comprised of non-profit or government health providers.
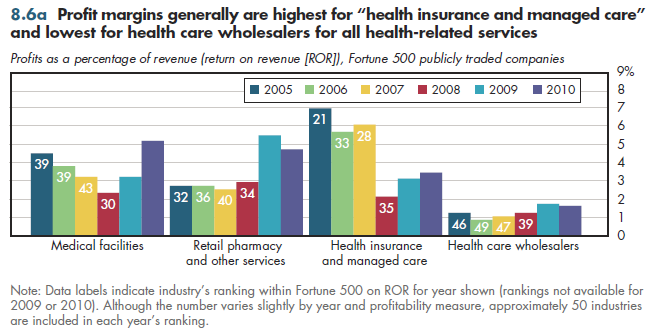
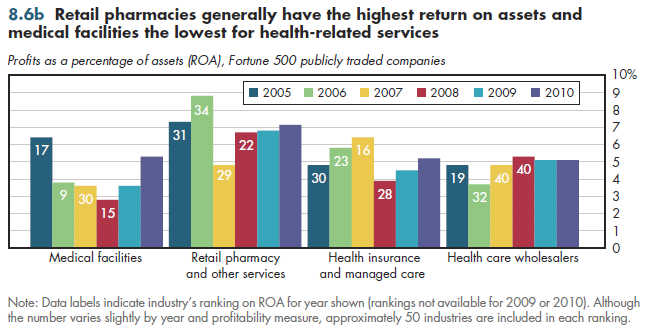
An arguably fairer apples-to-apples comparison would be to restrict the comparison to for-profit firms within each sector. The most readily available numbers are rankings among Fortune 500 firms grouped by major industry (approximately 50 such industries are included in these rankings). This clearly is not complete because it ignores small- and medium-sized firms. Nevertheless, the Fortune 500 typically accounts for the lion's share of output in a given industry. Thus, these rankings provide an approximate idea of how health care firms compare to the rest of the economy. In figures 8.6a-c, the numbers in each bar show the ranking of each industry relative to all major U.S. industries. Although industry rankings were not reported with the most recently released 2009 and 2010 profit numbers, they are not likely to be sharply different from the rankings for prior years.


I start with health services industries and then turn to goods-producing components of health care (pharmaceuticals and medical equipment) in figures 8.7a-c. There are three standard measures of profits. In each case, profits are defined as the difference between revenues and costs, but the denominator used to calculate the profit rate differs. Return on revenue (ROR), what many call "profit margin," calculates profits as a percent of total revenues. Most health services industries have single-digit RORs of less than 5 percent (figure 8.6a).
When profits are divided by assets, that is, the overall capital invested in a given company, the result is return on assets (ROA). Assets equal both equity (for example, stocks) and debt. Such returns also are typically at single-digit levels for health services industries (figure 8.6b). The final measure divides only by equity, that is, to exclude debt. Using the return on equity (ROE), the health services industries attain double-digit levels of returns, but again these typically rank them in the bottom half of industries overall (figure 8.6c).
No tables for figures since source is reported on each sheet.
Download PowerPoint versions of both figures.
- Fortune 500. Our Annual Ranking of America's Largest Corporations. http://money.cnn.com/magazines/fortune/fortune500/2009/performers/industries/ profits/index.html (accessed June 9, 2010).


