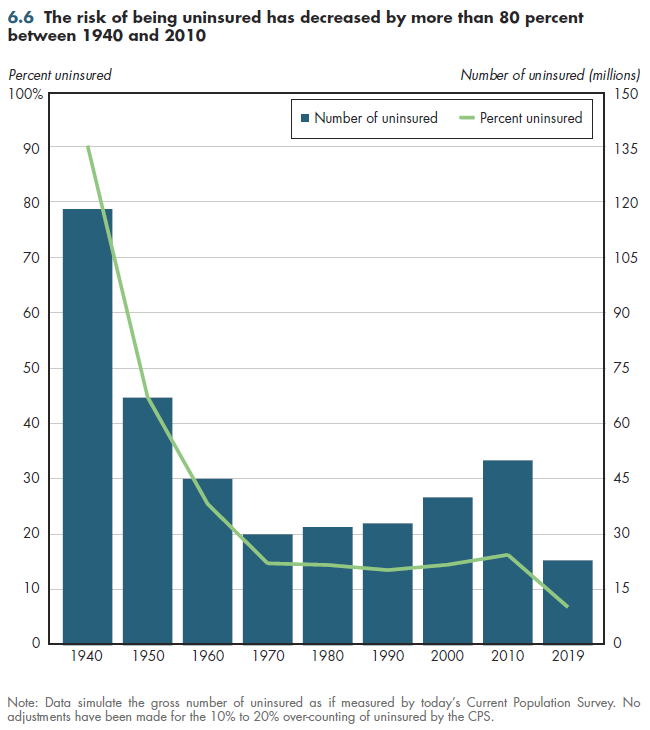
Over 70 years, the uninsured rate has declined by more than 80 percent (figure 6.6). It is noteworthy to see how much of this decline occurred before the arrival of Medicare and Medicaid. In 1940, approximately nine of 10 Americans lacked health insurance coverage. By 1960, this had fallen to 25 percent. This dramatic decline reflected the enormous expansion of employer-based health coverage fueled by the tax subsidy that began in 1943.

These numbers are approximations for the earliest decades. The nation did not start to seriously measure the extent of lack of coverage until the mid-1970s. Before that time, only insurance industry surveys of members who might have duplicate coverage across various types of policies exist (for example, hospital insurance). Thus, using assumptions about the fraction of the population without any coverage and how much overlap there was between policies of various types and then subtracting this insured number from the total population provides a count of the uninsured. Today, the most widely quoted current numbers about the uninsured come from the Current Population Survey (CPS), which did not start collecting a consistent measure of coverage until 1988. Now there are multiple surveys, each with various shortcomings. The point is that the numbers for 1990 forward are a better approximation of the truth than the numbers that precede it.
By 1970, the uninsured rate had fallen to less than 15 percent, reflecting continued expansion of employer-provided coverage and the introduction of Medicare and Medicaid. As will be shown, there is substantial evidence of "crowd-out" of private health coverage by both programs, so the entire decline cannot be attributed to public coverage. After 1970, the uninsured rate remained quite stable for decades. The slight increase between 1990 and 2010 is barely a blip from this much longer-term view.
Official government projections of what is supposed to happen to the uninsured rate if health reform is fully implemented are included. If this will happen remains to be seen, but the 2019 number is simply a reminder that the health reform plan did not intend, nor will it possibly achieve, universal coverage. Some 20 million uninsured Americans would still be uninsured that year, according to official forecasts.
Download Excel tables used to create figure:
Figure 6.6 Table.
Figure 6.6 was created from the following table (the workbook includes all supporting tables used to create this table):
- Table 6.6. Number of Uninsured and Percentage of Population Without Health Insurance Coverage, by Decade, 1940-2021
Download PowerPoint versions of both figures.
- Author's calculations.
- Department of Commerce. Bureau of the Census.
- Health Insurance Association of America. Source Book of Health Insurance Data 1986/1987. Table 1.1. Washington DC. HIAA 1987.


