Download PowerPoint versions of figure.
There’s no table for figure since source is included directly on the slide.
Summary: Almost all Medicare beneficiaries pay less in payroll taxes than the dollar amount of benefits they receive from the program.
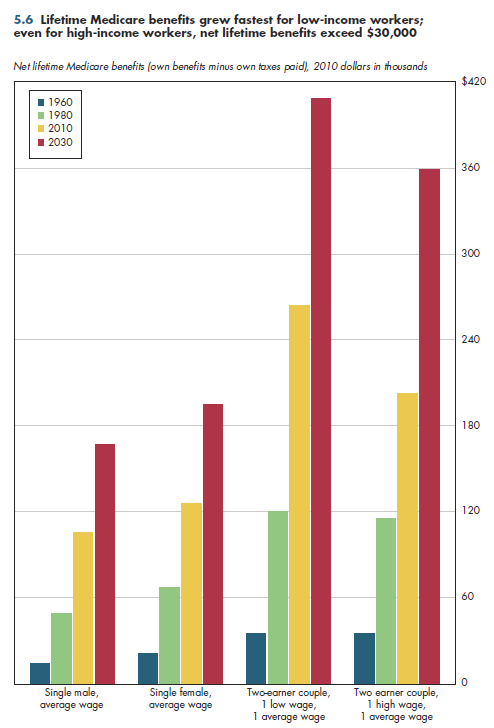
Most Medicare beneficiaries—even those who have high incomes—do not pay for themselves. The difference between the dollar value of lifetime benefits paid and the dollar amount of lifetime payroll taxes is generally measured in tens of thousands of dollars per Medicare beneficiary, as shown in figure 5.6. These calculations use inflation-adjusted dollars and a reasonable discount rate to equalize future dollars with today's dollars.

For most income groups, the net lifetime benefits of Medicare have increased over time. This reflects that growth in per capita medical spending has outpaced the rate of increases in wages and salaries over time. It also is a function of increases in life expectancy, which have had a far larger impact on lifetime medical expenses financed by Medicare than on the amount of lifetime payroll taxes paid into Medicare. In figure 5.6, low-income individuals are represented by those whose average lifetime earnings are $5,000 annually, while high-income individuals are assumed to have average annual lifetime earnings of $140,000; these individuals comprise a small fraction of Medicare beneficiaries.
For this highest-income group, net lifetime benefits no longer kept increasing for those who became eligible for Medicare in 1995. This reflects the elimination of the cap on earnings to which the 2.9 percent Medicare payroll tax originally applied. Clearly, for those who have extremely high incomes, for example, averaging $300,000 per year, lifetime Medicare benefits might well be negative, but this situation affects a minuscule fraction of current eligible individuals. This number surely would grow under the new taxes included under health reform. These are restricted to high-income households and include increasing the payroll tax deduction by 0.9 percentage points and imposing, for the first time, a 3.8 percent tax on investment income.
Regardless of whether their net Medicare benefits are positive or negative, it would be far more efficient, as noted for the tax exclusion, for high-income individuals to finance their own Medicare benefits directly than to provide benefits because they already had paid for them through various taxes.
Download PowerPoint versions of figure.
There’s no table for figure since source is included directly on the slide.