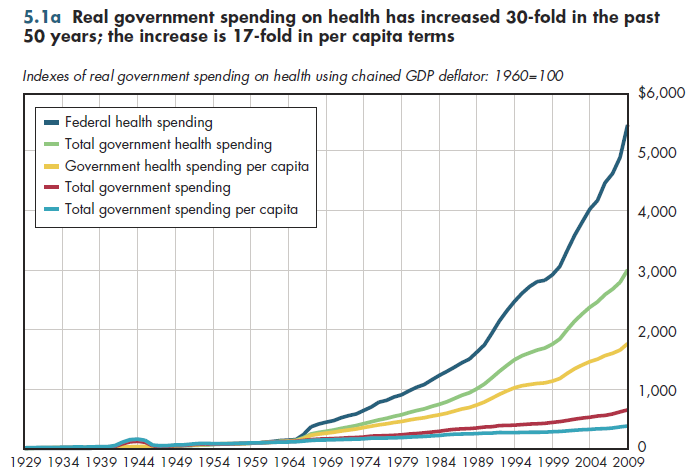
The rise in government-funded health care has been extraordinary by any measure. In terms of constant purchasing power for everyday goods, tax-financed health care has increased 30-fold just since 1960 (figure 5.1a). This includes all federal, state, and local government spending for health care, such as public health, direct delivery of health services, public health insurance, and investments in medical R&D and facilities construction. However, real federal spending on health care grew far faster than tax-paid health care overall. This reflects a substantial shift in the relative roles of federal government vis-à-vis state and local governments in financing (and regulating) health care.

In per capita terms, the overall increase was 17-fold. This does not mean that real health output funded by taxpayers rose 17-fold in 50 years. The inflation adjustment used for all series in figure 5.1a is based on the GDP price deflator rather than a medical price deflator. Thus, the increase represents how much more real output in the general economy was foregone to bankroll the tax-financed share of U.S. health spending. This rapid increase in government health spending was approximately five times as large as the increase in overall government spending during the same time.
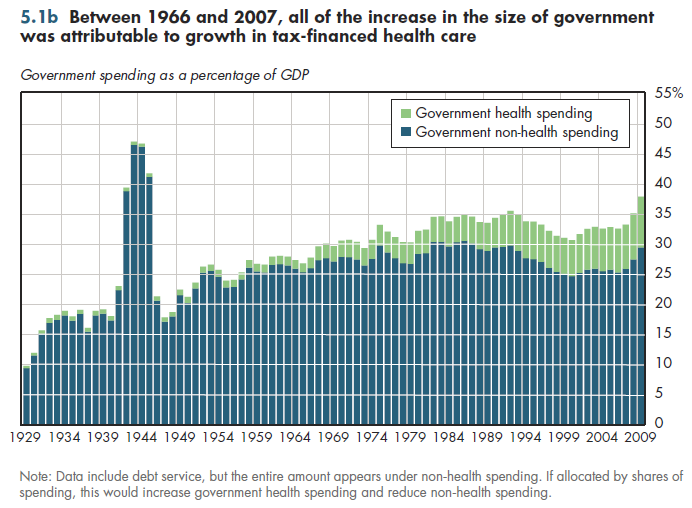
Recall from chapter 1 that real GDP also grew enormously during this period. As a share of GDP, publicly-financed health spending in 2007 (the most recent "normal" year) was five times as large as it was in 1965 (figure 5.1b). In contrast, the share of the economy attributable to government spending on all other activities unrelated to health was almost identical in these two years. In summary, the entire amount of the increase in the size of government between those years was accounted for by rising public expenditures on health care.

Except for a brief downward turn during the latter half of the 1990s, the tax-financed health share of the economy has risen without exception each year since 1929.
Download Excel tables used to create
Figures 5.1a/5.1b Tables.
Figures 5.1a and 5.1b were created from the following table (the workbook includes all supporting tables used to create this table):
- Fig. 5.1a: Table 5.1.1. Total and Health-Related Government Expenditures Based on Chained 2009 Dollars: 1929-2021
- Fig. 5.1b: Table 5.1.2. Total Government Expenditures on Health Care as a Percent of GDP: 1929-2021
Download PowerPoint versions of both figures.
- Author's calculations.
- Department of Commerce. Bureau of Economic Analysis.
- Department of Health and Human Services. Centers for Medicare and Medicaid Services.
- Worthington NL. National Health Expenditures, Calendar Years 1929-73. Research and Statistics Note No 1. Office of Research and Statistics 1975.


