Skip to content Skip to navigation

You are here: Home » Content » 1.1 Growth in Health Spending, 1929 to Present

Navigation

Recently Viewed

This feature requires Javascript to be enabled.
Download
×

Download module as:

  • PDF
  • EPUB (what's this?)

    What is an EPUB file?

    EPUB is an electronic book format that can be read on a variety of mobile devices.

    Downloading to a reading device

    For detailed instructions on how to download this content's EPUB to your specific device, click the "(what's this?)" link.

  • More downloads ...
Reuse / Edit
×

Module:

Add to a lens
×

Add module to:

Add to Favorites
×

Add module to:


1.1 Growth in Health Spending, 1929 to Present

Module by: Christopher Conover. E-mail the author

Summary: Over eight decades, constant dollar U.S. health spending per person increased five times as much as real output per capita

Note: You are viewing an old version of this document. The latest version is available here.

Spending on health care in the United States has increased more than 60-fold since 1929.1 This remarkable growth is measured in constant dollars that equalize general purchasing power across decades.2 In contrast, the U.S. economy grew only 12-fold over the same period (figure 1.1a).
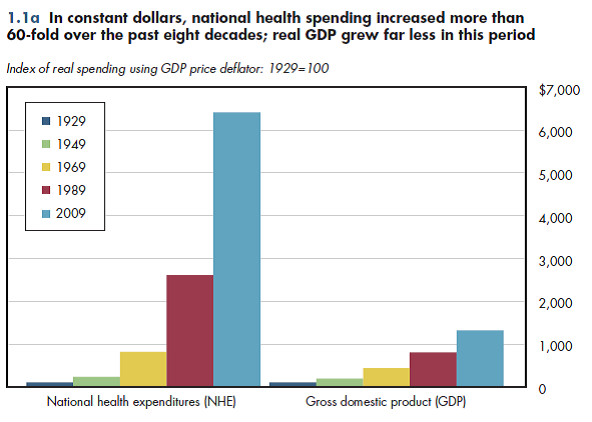
In constant dollars, national health spending increased more than 60-fold over the past eight decades; real GDP grew far less in this period.

National health expenditures (NHE) and NHE per capita are the best available single measures of the size of the health sector.3 NHE reflects the total amount of spending on health care, including goods and services having to do with personal health care, public health activities, public and private health insurance, related investments in research, and capital investment.4 Both gross domestic product (GDP) and NHE measure output only within the borders of the United States.5

The U.S. population is approximately 2.5 times as large as it was in 1929. Even when considering spending growth in per capita terms, inflation-adjusted health spending was 25 times as large at the end of these 80 years as at the start. GDP per capita quintupled (figure 1.1b). Does this mean that today’s average Americans receive 25 times as much medical care as their counterparts did in 1929? It does not. Figures 1.1a and 1.1b show how the total dollars spent on health care changed over time, but the estimates shown are adjusted only for changes in general purchasing power rather than purchasing power within the health sector. Devoting 25 times as much real economic output to purchasing medical care is not equivalent to saying that U.S. residents receive 25 times as much medical services (for example, physician visits, hospital days) as they did in 1929.
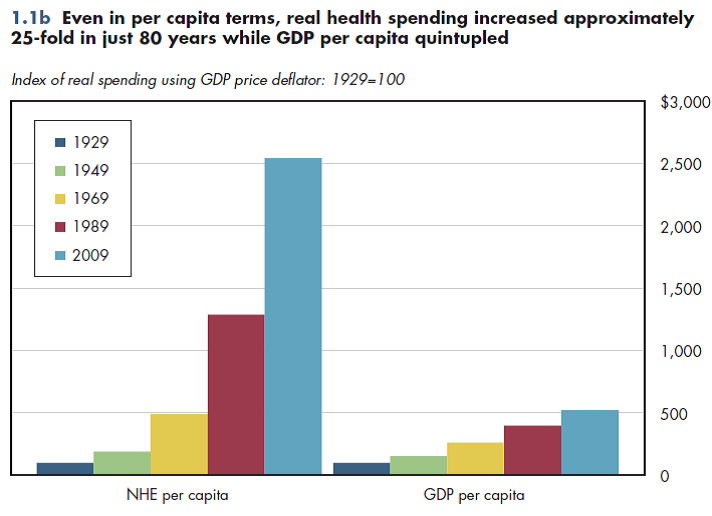
Even in per capita terms, real health spending grew about 25-fold in just 80 years, while GDP per capita quintupled.

The GDP implicit price deflator is the most comprehensive measure of pure price inflation for the economy as a whole. The Consumer Price Index (CPI) is better known but covers only approximately 60 percent of the economy, omitting rural areas, government purchases, and investment goods. Because half of health spending currently is publicly funded, it is more accurate to use a price index, such as the GDP deflator, that broadly reflects the entire economy. Adjusting NHE by the GDP deflator reflects the opportunity cost of health care, which measures how the total value of other goods and services that society could have purchased instead of health care has changed over time, while excluding a cause of growth—economy-wide inflation— largely beyond the control of the health sector.

Downloads

Download Excel tables used to create both figures: Figures 1.1a/1.1b Tables. This workbook includes:

  • Table 1.1 | U.S. Total Real National Health Expenditures Using Alternative Price Deflators: 1929 to 2021
  • Table 1.1a. Inflation in the U.S. Health Sector Using Alternative Price Indexes: 1929 to 2021

Download PowerPoint versions of both figures.

References

  1. Centers for Medicare and Medicaid Services (CMS). National Health Expenditures Accounts: Methodology Paper, 2011. Definitions, Sources, and Methods. 2011a. Available at: http://www.cms.gov/Research-Statistics-Data-and-Systems/Statistics-Trends-and-Reports/NationalHealthExpendData/Downloads/dsm-11.pdf (accessed January 10, 2013).
  2. Centers for Medicare and Medicaid Services (CMS). Quick Definitions for National Health Expenditure Accounts (NHEA) Categories. 2011b. Available at: http://www.cms.gov/Research-Statistics-Data-and-Systems/Statistics-Trends-and-Reports/NationalHealthExpendData/Downloads/quickref.pdf (accessed January 10, 2013).
  3. Centers for Medicare and Medicaid Services (CMS), Office of the Actuary. National Health Expenditures by type of service and source of funds: CY 1960-2011. Last updated December 27, 2012. Available at: https://www.cms.gov/Research-Statistics-Data-and-Systems/Statistics-Trends-and-Reports/NationalHealthExpendData/Downloads/NHE2011.zip (accessed January 10, 2013).
  4. Cooper BS, NL Worthington and MF McGee. Compendium of National Health Expenditures Data. DHEW Pub No (SSA) 73-11903. Office of Research and Statistics. 1973.
  5. Hartman MB, RJ Kornfeld, and AC Catlin. A Reconciliation of Health Care Expenditures in the National Health Expenditures Accounts and in Gross Domestic Product . Survey of Current Business, September 2010: 42-52. Available at: http://www.bea.gov/scb/pdf/2010/09%20September/0910_healthcare.pdf (accessed March 21, 2013).

Footnotes

  1. U.S. health expenditures are tracked by the Centers for Medicare and Medicaid Services (CMS). Historical data from 1960-2011 are on-line (CMS 2012). Data for 1929-1960 are reported in Cooper, Worthington and McGee, 1973. These historical figures were adjusted by author assuming that the difference between CMS and SSA-reported figures in 1960 persisted back to 1929.
  2. Both GDP and health spending have been adjusted using the GDP price deflator reported by the Bureau of Economic Analysis.
  3. The health sector is currently the largest single share of the economy (CMS 2011a). The National Health Expenditure Accounts (NHEA) are compatible with the National Income and Product Accounts (NIPA), but provide a more complete picture of the health care sector of the nation's economy in a single set of statistics. NHEA are comprehensive (including all main components of the health care system), multi-dimensional (tracking both expenditures and sources of funds), and consistent (using a common set of definitions that permits comparisons among categories and over time). A detailed explanation of the difference between the slightly higher NHE figure calculated by CMS and the one calculated by BEA for the NIPA is provided by Hartman, Kornfeld and Catlin (2010).
  4. Quick Definitions are at CMS (2011b). A complete description of definitions, sources and methods is at CMS (2011a).
  5. "The cost of medical care administered outside the U.S. is not included in the NHEA" (CMS 2011a:6). Thus, NHE currently does not capture medical tourism by U.S. residents, but it does capture medical tourism of people who come to the U.S. for medical care.

Content actions

Download module as:

PDF | EPUB (?)

What is an EPUB file?

EPUB is an electronic book format that can be read on a variety of mobile devices.

Downloading to a reading device

For detailed instructions on how to download this content's EPUB to your specific device, click the "(?)" link.

| More downloads ...

Add module to:

My Favorites (?)

'My Favorites' is a special kind of lens which you can use to bookmark modules and collections. 'My Favorites' can only be seen by you, and collections saved in 'My Favorites' can remember the last module you were on. You need an account to use 'My Favorites'.

| A lens I own (?)

Definition of a lens

Lenses

A lens is a custom view of the content in the repository. You can think of it as a fancy kind of list that will let you see content through the eyes of organizations and people you trust.

What is in a lens?

Lens makers point to materials (modules and collections), creating a guide that includes their own comments and descriptive tags about the content.

Who can create a lens?

Any individual member, a community, or a respected organization.

What are tags? tag icon

Tags are descriptors added by lens makers to help label content, attaching a vocabulary that is meaningful in the context of the lens.

Reuse / Edit:

Reuse or edit module (?)

Check out and edit

If you have permission to edit this content, using the "Reuse / Edit" action will allow you to check the content out into your Personal Workspace or a shared Workgroup and then make your edits.

Derive a copy

If you don't have permission to edit the content, you can still use "Reuse / Edit" to adapt the content by creating a derived copy of it and then editing and publishing the copy.

  • © 2012 Regents of the University of Minnesota. All rights reserved.
  • The University of Minnesota is an equal opportunity educator and employer. Privacy
  • Last modified on Jul 24, 2013 3:07 pm -0500